As we near the end of the series, we're going look at …
As we near the end of the series, we're going look at how statistics impacts our lives. Today, we're going to discuss how statistics is often used and misused in the courtroom. We're going to focus on three stories in which three huge statistical errors were made: the handwriting analysis of French officer Alfred Dreyfus in 1894, the murder charges of mother Sally Clark in 1998, and the expulsion of student Jonathan Dorfman from UC San Diego in 2011.
We've talked a lot about modeling data and making inferences about it, …
We've talked a lot about modeling data and making inferences about it, but today we're going to look towards the future at how machine learning is being used to build models to predict future outcomes. We'll discuss three popular types of supervised machine learning models: Logistic Regression, Linear discriminant Analysis (or LDA) and K Nearest Neighbors (or KNN). For a broader overview of machine learning, check out our episode in Crash Course Computer Science!
Today we're going to walk through a couple of statistical approaches to …
Today we're going to walk through a couple of statistical approaches to answer the question: "is coffee from the local cafe, Caf-fiend, better than that other cafe, The Blend Den?" We'll build a two sample t-test which will tell us how many standard errors away from the mean our observed difference is in our tasting experiment, and then we'll introduce a matched pair t-tests which allow us to remove variation in the experiment. All of these approaches rely on the test statistic framework we introduced last episode.
Test statistics allow us to quantify how close things are to our …
Test statistics allow us to quantify how close things are to our expectations or theories. Instead of going on our gut feelings, they allow us to add a little mathematical rigor when asking the question: “Is this random… or real?” Today, we’ll introduce some examples using both t-tests and z-tests and explain how critical values and p-values are different ways of telling us the same information. We’ll get to some other test statistics like F tests and chi-square in a future episode.
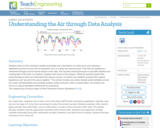
Students build on their existing air quality knowledge and a description of …
Students build on their existing air quality knowledge and a description of a data set to each develop a hypothesis around how and why air pollutants vary on a daily and seasonal basis. Then they are guided by a worksheet through an Excel-based analysis of the data. This includes entering formulas to calculate statistics and creating plots of the data. As students complete each phase of the analysis, reflection questions guide their understanding of what new information the analysis reveals. At activity end, students evaluate their original hypotheses and “put all of the pieces together.” The activity includes one carbon dioxide worksheet/data set and one ozone worksheet/data set; providing students and/or instructors with a content option. The activity also serves as a good standalone introduction to using Excel.
Today we're going to discuss how machine learning can be used to …
Today we're going to discuss how machine learning can be used to group and label information even if those labels don't exist. We'll explore two types of clustering used in Unsupervised Machine Learning: k-means and Hierarchical clustering, and show how they can be used in many ways - from book suggestions and medical interventions, to giving people better deals on pizza!
Today we're going to discuss the role of statistics during war. From …
Today we're going to discuss the role of statistics during war. From helping the Allies break Nazi Enigma codes and estimate tank production rates to finding sunken submarines, statistics have and continue to play a critical role on the battlefield.
Welcome to Crash Course Statistics! In this series we're going to take …
Welcome to Crash Course Statistics! In this series we're going to take a look at the important role statistics play in our everyday lives, because statistics are everywhere! Statistics help us better understand the world and make decisions from what you'll wear tomorrow to government policy. But in the wrong hands, statistics can be used to misinform. So we're going to try to do two things in this series. Help show you the usefulness of statistics, but also help you become a more informed consumer of statistics. From probabilities, paradoxes, and p-values there's a lot to cover in this series, and there will be some math, but we promise only when it's most important. But first, we should talk about what statistics actually are, and what we can do with them. Statistics are tools, but they can't give us all the answers.
In our series finale, we're going to take a look at some …
In our series finale, we're going to take a look at some of the times we've used statistics to gaze into our crystal ball, and actually got it right! We'll talk about how stores know what we want to buy (which can sometimes be a good thing), how baseball was changed forever when Paul DePodesta created a record-winning Oakland A's baseball team, and how statistics keeps us safe with the incredible strides we've made in weather forecasting. Statistics are everywhere, and even if you don't remember all the formulae and graphs we've thrown at you in this series, we hope you take with you a better appreciation of the many ways statistics impacts your life, and hopefully we've given your a more math-y perspective on how the world works. Thanks so much for watching DFTBAQ!
Think you're good at guessing stats? Guess again. Whether we consider ourselves …
Think you're good at guessing stats? Guess again. Whether we consider ourselves math people or not, our ability to understand and work with numbers is terribly limited, says data visualization expert Alan Smith. In this delightful talk, Smith explores the mismatch between what we know and what we think we know.
Today we’re going to talk about Bayes Theorem and Bayesian hypothesis testing. …
Today we’re going to talk about Bayes Theorem and Bayesian hypothesis testing. Bayesian methods like these are different from how we've been approaching statistics so far, because they allow us to update our beliefs as we gather new information - which is how we tend to think naturally about the world. And this can be a really powerful tool, since it allows us to incorporate both scientifically rigorous data AND our previous biases into our evolving opinions.
Today we’re going to talk about how we compare things that aren’t …
Today we’re going to talk about how we compare things that aren’t exactly the same - or aren’t measured in the same way. For example, if you wanted to know if a 1200 on the SAT is better than the 25 on the ACT. For this, we need to standardize our data using z-scores - which allow us to make comparisons between two sets of data as long as they’re normally distributed. We’ll also talk about converting these scores to percentiles and discuss how percentiles, though valuable, don’t actually tell us how “extreme” our data really is.
No restrictions on your remixing, redistributing, or making derivative works. Give credit to the author, as required.
Your remixing, redistributing, or making derivatives works comes with some restrictions, including how it is shared.
Your redistributing comes with some restrictions. Do not remix or make derivative works.
Most restrictive license type. Prohibits most uses, sharing, and any changes.
Copyrighted materials, available under Fair Use and the TEACH Act for US-based educators, or other custom arrangements. Go to the resource provider to see their individual restrictions.