This downloadable text features over 200 math problems that very closely follow …
This downloadable text features over 200 math problems that very closely follow the standard curriculum for high school Algebra 2 courses, but with a strong emphasis on space science and astronomy. Fourteen chapters featuring on-grade-level Algebra 2 concepts and skill areas including statistics, probability, conics, trigonometry, complex numbers and matrix algebra. Science topics are drawn from all areas of planetary, solar and astrophysics, in addition to space exploration and rocketry.
This final lesson in the unit culminates with the Go Public phase …
This final lesson in the unit culminates with the Go Public phase of the legacy cycle. In the associated activities, students use linear models to depict Hooke's law as well as Ohm's law. To conclude the lesson, students apply they have learned throughout the unit to answer the grand challenge question in a writing assignment.
In this simulation of a doctor's office, students play the roles of …
In this simulation of a doctor's office, students play the roles of physician, nurse, patients, and time-keeper, with the objective to improve the patient waiting time. They collect and graph data as part of their analysis. This serves as a hands-on example of using engineering principles and engineering design approaches (such as models and simulations) to research, analyze, test and improve processes.
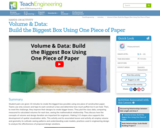
Student pairs are given 10 minutes to create the biggest box possible …
Student pairs are given 10 minutes to create the biggest box possible using one piece of construction paper. Teams use only scissors and tape to each construct a box and determine how much puffed rice it can hold. Then, to meet the challenge, they improve their designs to create bigger boxes. They plot the class data, comparing measured to calculated volumes for each box, seeing the mathematical relationship. They discuss how the concepts of volume and design iteration are important for engineers. Making 3-D shapes also supports the development of spatial visualization skills. This activity and its associated lesson and activity all employ volume and geometry to cultivate seeing patterns and understanding scale models, practices used in engineering design to analyze the effectiveness of proposed design solutions.
This lab demonstrates Ohm's law as students set up simple circuits each …
This lab demonstrates Ohm's law as students set up simple circuits each composed of a battery, lamp and resistor. Students calculate the current flowing through the circuits they create by solving linear equations. After solving for the current, I, for each set resistance value, students plot the three points on a Cartesian plane and note the line that is formed. They also see the direct correlation between the amount of current flowing through the lamp and its brightness.
Students are introduced to the "Walk the Line" challenge question. They write …
Students are introduced to the "Walk the Line" challenge question. They write journal responses to the question and brainstorm what information they need to answer the question. Ideas are shared with the class (or in pairs and then to the class, if class size is large). Then students read an interview with an engineer to gain a professional perspective on linear data sets and best-fit lines. Students brainstorm for additional ideas and add them to the list. With the teacher's guidance, students organize the ideas into logical categories of needed knowledge.
Students learn about complex networks and how to represent them using graphs. …
Students learn about complex networks and how to represent them using graphs. They also learn that graph theory is a useful mathematical tool for studying complex networks in diverse applications of science and engineering, such as neural networks in the brain, biochemical reaction networks in cells, communication networks, such as the internet, and social networks. Topics covered include set theory, defining a graph, as well as defining the degree of a node and the degree distribution of a graph.
Learn about computers, programming and technology through these free, fun activities. Puzzles …
Learn about computers, programming and technology through these free, fun activities. Puzzles Activities Geometry Counting Algorithms Estimation Computers Robots Captcha & Much more!
A brief refresher on the Cartesian plane includes how points are written …
A brief refresher on the Cartesian plane includes how points are written in (x, y) format and oriented to the axes, and which directions are positive and negative. Then students learn about what it means for a relation to be a function and how to determine domain and range of a set of data points.
Graphs and charts are great because they communicate information visually. For this …
Graphs and charts are great because they communicate information visually. For this reason, graphs are often used in newspapers, magazines and businesses around the world.
NCES constantly uses graphs and charts in our publications and on the web. Sometimes, complicated information is difficult to understand and needs an illustration. Graphs or charts can help impress people by getting your point across quickly and visually.
Here you will find five different graphs and charts for you to consider.
An interactive applet that allows the user to graphically explore the properties …
An interactive applet that allows the user to graphically explore the properties of a cubic equation. Specifically, it is designed to foster an intuitive understanding of the effects of changing the 4 coefficients in the function. The applet shows a large graph of a quadratic (ax^3 + bx^2 +cx + d) and has four slider controls, one each for the coefficients a,b,c and d. As the sliders are moved, the graph is redrawn in real time illustrating the effects of these variations. Applet can be enlarged to full screen size for use with a classroom projector. This resource is a component of the Math Open Reference Interactive Geometry textbook project at http://www.mathopenref.com.
Using a website simulation tool, students build on their understanding of random …
Using a website simulation tool, students build on their understanding of random processes on networks to interact with the graph of a social network of individuals and simulate the spread of a disease. They decide which two individuals on the network are the best to vaccinate in an attempt to minimize the number of people infected and "curb the epidemic." Since the results are random, they run multiple simulations and compute the average number of infected individuals before analyzing the results and assessing the effectiveness of their vaccination strategies.
Students design and build model landfills using materials similar to those used …
Students design and build model landfills using materials similar to those used by engineers for full-scale landfills. Their completed small-size landfills are "rained" on and subjected to other erosion processes. The goal is to create landfills that hold the most garbage, minimize the cost to build and keep trash and contaminated water inside the landfill to prevent it from causing environmental damage. Teams create designs within given budgets, test the landfills' performance, and graph and compare designs for capacity, cost and performance.
Student teams design and create LEGO® structures to house and protect temperature …
Student teams design and create LEGO® structures to house and protect temperature sensors. They leave their structures in undisturbed locations for a week, and regularly check and chart the temperatures. This activity engages students in the design and analysis aspects of engineering.
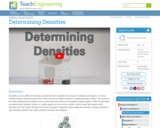
Students use two different methods to determine the densities of a variety …
Students use two different methods to determine the densities of a variety of materials and objects. The first method involves direct measurement of the volumes of objects that have simple geometric shapes. The second is the water displacement method, used to determine the volumes of irregularly shaped objects. After the densities are determined, students create x-y scatter graphs of mass versus volume, which reveal that objects with densities less than water (floaters) lie above the graph's diagonal (representing the density of water), and those with densities greater than water (sinkers) lie below the diagonal.
Students drop water from different heights to demonstrate the conversion of water's …
Students drop water from different heights to demonstrate the conversion of water's potential energy to kinetic energy. They see how varying the height from which water is dropped affects the splash size. They follow good experiment protocol, take measurements, calculate averages and graph results. In seeing how falling water can be used to do work, they also learn how this energy transformation figures into the engineering design and construction of hydroelectric power plants, dams and reservoirs.
Students learn how to use and graph real-world stream gage data to …
Students learn how to use and graph real-world stream gage data to create event and annual hydrographs and calculate flood frequency statistics. Using an Excel spreadsheet of real-world event, annual and peak streamflow data, they manipulate the data (converting units, sorting, ranking, plotting), solve problems using equations, and calculate return periods and probabilities. Prompted by worksheet questions, they analyze the runoff data as engineers would. Students learn how hydrographs help engineers make decisions and recommendations to community stakeholders concerning water resources and flooding.
Students learn about four forms of equations: direct variation, slope-intercept form, standard …
Students learn about four forms of equations: direct variation, slope-intercept form, standard form and point-slope form. They graph and complete problem sets for each, converting from one form of equation to another, and learning the benefits and uses of each.
No restrictions on your remixing, redistributing, or making derivative works. Give credit to the author, as required.
Your remixing, redistributing, or making derivatives works comes with some restrictions, including how it is shared.
Your redistributing comes with some restrictions. Do not remix or make derivative works.
Most restrictive license type. Prohibits most uses, sharing, and any changes.
Copyrighted materials, available under Fair Use and the TEACH Act for US-based educators, or other custom arrangements. Go to the resource provider to see their individual restrictions.