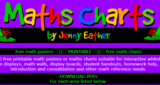
Over 270 free printable math posters or maths charts suitable for interactive …
Over 270 free printable math posters or maths charts suitable for interactive whiteboards, classroom displays, math walls, display boards, student handouts, homework help, concept introduction and consolidation and other math reference needs.
No restrictions on your remixing, redistributing, or making derivative works. Give credit to the author, as required.
Your remixing, redistributing, or making derivatives works comes with some restrictions, including how it is shared.
Your redistributing comes with some restrictions. Do not remix or make derivative works.
Most restrictive license type. Prohibits most uses, sharing, and any changes.
Copyrighted materials, available under Fair Use and the TEACH Act for US-based educators, or other custom arrangements. Go to the resource provider to see their individual restrictions.