
Practical, common-sense maths for adults. Topic areas include:
-Numbers
-Calculations
-Percent and Fractions
-Measuring
-Shapes
-Graphs
- Subject:
- Math
- Material Type:
- Activity/Lab
- Date Added:
- 03/25/2019

This is a general collection of math resources. It is a large collection, but you can use the fliters on the left side of the screen to filter down to the specific education level you are looking for. (You are encouraged to filter by education level, not grade.)
Practical, common-sense maths for adults. Topic areas include:
-Numbers
-Calculations
-Percent and Fractions
-Measuring
-Shapes
-Graphs
In this activity students use their Log Tapes as a reference for ordered pairs, and graph positive numbers as a function of their base-10 logarithms. They extend each plotted point to the vertical axis, thereby generating a logarithmic scale that cuts and folds into an improvised slide rule.åÊThis is activity E1 in the "Far Out Math" educator's guide. Lessons in the guide include activities in which students measure,compare quantities as orders of magnitude, become familiar with scientific notation, and develop an understanding of exponents and logarithms using examples from NASA's GLAST mission. These are skills needed to understand the very large and very small quantities characteristic of astronomical observations. Note: In 2008, GLAST was renamed Fermi, for the physicist Enrico Fermi.åÊ
An interactive applet and associated web page that demonstrate the slope (m) of a line. The applet has two points that define a line. As the user drags either point it continuously recalculates the slope. The rise and run are drawn to show the two elements used in the calculation. The grid, axis pointers and coordinates can be turned on and off. The slope calculation can be turned off to permit class exercises and then turned back on the verify the answers. The applet can be printed as it appears on the screen to make handouts. The web page has a full description of the concept of slope, a worked example and has links to other pages relating to coordinate geometry. Applet can be enlarged to full screen size for use with a classroom projector. This resource is a component of the Math Open Reference Interactive Geometry textbook project at http://www.mathopenref.com.
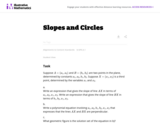
The purpose of this task is to lead students through an algebraic approach to a well-known result from classical geometry, namely, that a point X is on the circle of diameter AB whenever _AXB is a right angle.
Slow Reveal Graph (#slowrevealgraph) is an instructional routine that promotes sensemaking about data. This highly engaging routine uses scaffolded visuals and discourse to help students (in K-12 and beyond) make sense of data. As more and more of the graph is revealed, students refine their interpretation and construct meaning, often in surprising ways. This routine increases access for students without sacrificing rigor or engagement.
You will find all types of graphs for all ages of learners from elementary to high school.
Here are the steps:
- It starts with a graph that has been stripped of context: its numbers, its labels, its title.
- The teacher facilitates a discussion around what students notice and wonder. (The slides give discussion suggestions)
- Then another slide is revealed.
- Students identify what information is new.
- Then another slide is revealed.
- Again, students identify what information is new (the title) and discuss how this changes their understanding of the graph.
- As more slides are added, more insight into this data representation is revealed.
The introductory page for the graph also offers more information about the context for this graph, other content connections, and paired texts for students to explore.
The purpose of this task is to give students experience modeling a real-world example of exponential growth, in a context that provides a vivid illustration of the power of exponential growth, for example the cost of inaction for a year.
Total solar eclipses are quite rare, so much so that they make the news when they do occur. This task explores some of the reasons why. Solving the problem is a good application of similar triangles
This activity is about planetary distances. Learners will create a model of the solar system using beads and string, and compare planetary sizes using common types of fruit and seeds. The lesson models scientific inquiry using the 5E instructional model and includes teacher notes and vocabulary.
This is an online lesson associated with activities during Solar Week, a twice-yearly event in March and October during which classrooms are able to interact with scientists studying the Sun. Outside of Solar Week, information, activities, and resources are archived and available online at any time. This is an activity about measurements of solar activity. Learners will observe an image of the Sun and sketch major features, plot data to begin to recognize patterns of solar activity, look for long-term patterns in graphed data, compare X-ray and visible light images of the Sun to find solar features common to both sets of images, and make a prediction of what the Sun will look like in a visible light image after observing an X-ray image taken on the same day. This activity is scheduled to occur during Monday of Solar Week.
This short video and interactive assessment activity is designed to teach second graders about identifying and naming 3d figures.
This short video and interactive assessment activity is designed to teach third graders about identifying and naming 3d figures.
The typical system of equations or inequalities problem gives the system and asks for the graph of the solution. This task turns the problem around. It gives a solution set and asks for the system that corresponds to it. The purpose of this task is to give students a chance to go beyond the typical problem and make the connections between points in the coordinate plane and solutions to inequalities and equations. Students have to focus on what the graph is showing.
Webmath is a math-help web site that generates answers to specific math questions and problems, as entered by a user, at any particular moment. The math answers are generated and displayed real-time, at the moment a web user types in their math problem and clicks "solve." In addition to the answers, Webmath also shows the student how to arrive at the answer.
This short video and interactive assessment activity is designed to teach second graders about solving decimal word puzzles.
This task requires students to think about equations and solve them using pictures.
This short video and interactive assessment activity is designed to teach fourth graders about solving length and distance problems involving time - word problems.
This short video and interactive assessment activity is designed to teach third graders about solving multi-step problems involving time.
This is a lesson about using the light from the star during an occultation event to identify the atmosphere of a planet. Learners will add and subtract light curves (presented as a series of geometrical shapes) to understand how this could occur. The activity is part of Project Spectra, a science and engineering program for middle-high school students, focusing on how light is used to explore the Solar System.
This short video and interactive assessment activity is designed to teach fourth graders about solving for elapsed time related to rate.
This short video and interactive assessment activity is designed to teach third graders about solving for elapsed time related to rate.