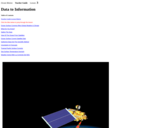
In this activity, students investigate sea level change during glacial maxima during …
In this activity, students investigate sea level change during glacial maxima during the Ice Ages, and learn how lowered sea level presented additional routes for intercontinental human migration. Summary background information, data and images supporting the activity are available on the Earth Update data site. To complete the activity, students will need to access the Space Update multimedia collection, which is available for download and purchase for use in the classroom.
This example explains how contour mapping teaches both estimation and spatial visualization …
This example explains how contour mapping teaches both estimation and spatial visualization skills. To have experience visualizing 3-dimensional fields from a 2-dimensional map helps students throughout their mathematical career. This resource is from PUMAS - Practical Uses of Math and Science - a collection of brief examples created by scientists and engineers showing how math and science topics taught in K-12 classes have real world applications.
In this activity, student teams identify the locations of coral reefs around …
In this activity, student teams identify the locations of coral reefs around the world, examine infrared satellite images of the Earth, and research the impacts that are threatening the survival of coral reefs. Each team creates a short oral presentation describing the coral reef they have researched. Students then plot on a composite map the locations where coral bleaching is occurring. Student worksheets, a teacher guide, and assessment rubric are included. This activity is part of Coastal Areas: Coral Reefs in Hot Water, part of the lesson series, The Potential Consequences of Climate Variability and Change.
You can find statistics in every day life - this example explains …
You can find statistics in every day life - this example explains how to calculate the chance of a member of a committee is receiving a bribe. This resource is from PUMAS - Practical Uses of Math and Science - a collection of brief examples created by scientists and engineers showing how math and science topics taught in K-12 classes have real world applications.
In this example, students learn how to read a topographic map and …
In this example, students learn how to read a topographic map and understand map contours. This resource is from PUMAS - Practical Uses of Math and Science - a collection of brief examples created by scientists and engineers showing how math and science topics taught in K-12 classes have real world applications.
What are air currents? Air currents are like rivers of wind caused …
What are air currents? Air currents are like rivers of wind caused by areas of high and low pressure.The air above the land is warmer and less dense, so it rises. The air over the water is cooler and heavier. The cool air rushes in toward the low-pressure zone over the land, forming a lovely sea breeze. But what about Jet Streams? In this episode of Crash Course Kids, Sabrina chats with us about all things relating to Air Currents.
This lesson incorporates sea surface data collected by NASA satellites. Data for …
This lesson incorporates sea surface data collected by NASA satellites. Data for three surface characteristics- height, temperature and speed- are used for several activities. Students examine the differences in speed of currents relative to distance from the Equator. Sea surface data anomalies are charted and further analyzed. In addition, surface current data is presented to examine patterns related to El Ni̱o. Note that this is lesson three of five on the Ocean Motion website. Each lesson investigates ocean surface circulation using satellite and model data and can be done independently. See Related URL's for links to the Ocean Motion Website that provide science background information, data resources, teacher material, student guides and a lesson matrix.
This feature article from the National Aeronautics and Space Administration (NASA) Earth …
This feature article from the National Aeronautics and Space Administration (NASA) Earth Observatory discusses the use of satellite imagery to evaluate desertification which is occurring in the Sahel, a region of central African savannah that forms the boundary between the Sahara Desert to the north and the wetter, more fertile regions to the south. Topics include the use of Very High Resolution Radiometer (VHRR) data, obtained from National Oceanic and Atmospheric Administration (NOAA) meteorological satellites, to develop a vegetation index, and exactly how the term 'desertification' should be defined in order to distinguish temporarily degraded land from that which has permanently lost productivity.
These two hands-on labs are about the role of temperature and salinity …
These two hands-on labs are about the role of temperature and salinity in governing the density of seawater, a major factor controlling the ocean's vertical movements and layered circulation. In the first activity students work in groups to determine the density of tap water and of tap water with salt, then compare the densities. The second activity investigates the role of temperature and salinity in determining seawater density. Students use a Temperature-Salinity (T-S) Diagram to examine the effect of mixing on density. A list of key concepts, essential questions, common preconceptions and more is included. These are part of the Aquarius Hands-on Laboratory Activities.
In this problem-based learning (PBL) activity, students take on the role of …
In this problem-based learning (PBL) activity, students take on the role of a student research scientist and explore the role of solar energy in determining climate, focusing on the urban heat island effect. Students conduct research and compare temperatures between two cities, and determine the factors that are responsible for the difference exhibited between them. The lesson is supported by teacher notes, answer key, glossary and an appendix with information about using PBL in the classroom. This is the third of three activities in Investigating the Climate System: Energy, a Balancing Act, and serves as an authentic assessment for all three modules.
Let's continue the exploration of the Water Cycle by drinking some dinosaur …
Let's continue the exploration of the Water Cycle by drinking some dinosaur pee. Yep! Well, it's a little less gross that it sounds. It turns out that all of the water on Earth is just constantly recycled in what we call a closed system. No water comes in and no water goes out. So that means that, at some point, it's possible the water we're drinking was once dinosaur pee... or tears...
It is common in the real world to see mathematical examples where …
It is common in the real world to see mathematical examples where the cents sign was used when the dollar sign was supposed to be used. Converting and comparing decimals and fractions can help clear up this misconception. Two real coupons clipped from a Sunday paper coupon section are included in this activity. This resource is from PUMAS - Practical Uses of Math and Science - a collection of brief examples created by scientists and engineers showing how math and science topics taught in K-12 classes have real world applications.
One particular type of domino game, sometimes called the All Fives Domino …
One particular type of domino game, sometimes called the All Fives Domino game, uses multiples of five in order to score points. It can be the basis for a number of games designed to develop conceptual understanding of multiples of numbers through twelve and provide opportunities to reinforce learning objectives in a fun and competitive manner. This resource is from PUMAS - Practical Uses of Math and Science - a collection of brief examples created by scientists and engineers showing how math and science topics taught in K-12 classes have real world applications.
This math problem demonstrates the concept of geometric progression, through an example …
This math problem demonstrates the concept of geometric progression, through an example of a million dollar contract between an employee and an employer. Application of the concept of geometric progression to social cause activism is addressed. This resource is from PUMAS - Practical Uses of Math and Science - a collection of brief examples created by scientists and engineers showing how math and science topics taught in K-12 classes have real world applications.
This movie provides an 18-minute introduction to how NASA is observing our …
This movie provides an 18-minute introduction to how NASA is observing our ever-changing planet. On the The Dynamic Earth DVD Web page you can download the video as an iPod or iPhone version, as well as an AppleTV/Full resolution version, and access a glossary and links to related Web sites.
In this chapter, students will explore relationships between air quality and population …
In this chapter, students will explore relationships between air quality and population density using the image visualization tool, Google Earth. You will learn how to download NO2 data and analyze them to develop a conceptual understanding of how population and topography can influence the air quality of a region. Once you have learned the techniques, you are encouraged to explore seasonal changes in nitrogen dioxide concentrations at other locations. This chapter is part of the Earth Exploration Toolbook (EET). Each EET chapter provides teachers and/or students with direct practice for using scientific tools to analyze Earth science data. Students should begin on the Case Study page.
Students will be guided through the process of locating and graphing web-based …
Students will be guided through the process of locating and graphing web-based environmental data that has been collected by GLOBE Program participants. This chapter highlights the opportunities for using GLOBE Program data to introduce basic concepts of Earth system science. It is part of the Earth Exploration Toolbook, which provides teachers and/or students with direct practice for using scientific tools to analyze Earth science data. Students should begin on the Case Study page.
This activity's storyline is built around the real-life case study of Dr. …
This activity's storyline is built around the real-life case study of Dr. Walt Meier, a Sea Ice Scientist from Boulder, Colorado. In the fictional story, the students of Churchill become concerned about wildlife in their region because polar bears have become a nuisance in the town. According to the local elders, the sea ice patterns have changed. The students turn to Dr. Meier for his expertise in sea ice analysis. Dr. Meier then instructs the students in the use of ImageJ and guides them through the research process. This chapter is part of the Earth Exploration Toolbook (EET). Each EET chapter provides teachers and/or students with direct practice for using scientific tools to analyze Earth science data. Students should begin on the Case Study page.
No restrictions on your remixing, redistributing, or making derivative works. Give credit to the author, as required.
Your remixing, redistributing, or making derivatives works comes with some restrictions, including how it is shared.
Your redistributing comes with some restrictions. Do not remix or make derivative works.
Most restrictive license type. Prohibits most uses, sharing, and any changes.
Copyrighted materials, available under Fair Use and the TEACH Act for US-based educators, or other custom arrangements. Go to the resource provider to see their individual restrictions.