This is a general collection of math resources. It is a large collection, but you can use the fliters on the left side of the screen to filter down to the specific education level you are looking for. (You are encouraged to filter by education level, not grade.)
Using the 5E instructional model, students discover the value of using color …
Using the 5E instructional model, students discover the value of using color maps to visualize data. The activity requires students to create a color map of the ozone hole from Dobson data values derived from the Aura satellite. Students then interpret that map and compare and evaluate different color scales. Note that this is the Spanish version of Exploring Color Maps: Using Stratospheric Ozone Data.
Through the use of the 5E instructional model, students discover the value …
Through the use of the 5E instructional model, students discover the value of using color maps to visualize data. The activity requires students to create a color map of the ozone hole from Dobson data values derived from the Aura satellite. Students then interpret that map and compare and evaluate different color scales.
This is a collection of mathematics problems relating to the moons of …
This is a collection of mathematics problems relating to the moons of the solar system. Learners will use simple proportional relationships and work with fractions to study the relative sizes of the larger moons in our solar system, and explore how temperatures change from place to place using the Celsius and Kelvin scales.
In this activity, student teams explore connections between parts of the Earth …
In this activity, student teams explore connections between parts of the Earth system, by examining a time series of environmental data maps. By examining scientific visualizations of a data pair in two time slices, they will see that the environment is the result of the interplay among many processes that take place on varying time and spatial scales. This is one of six interrelated learning activities associated with the GLOBE Earth System Poster, Exploring Connections in Year 2007, which also includes a series of assessment and extension activities. GLOBE (Global Learning and Observation to Benefit the Environment) is a worldwide, hands-on, K-12 school-based science education program.
In this activity, student teams explore connections between parts of the Earth …
In this activity, student teams explore connections between parts of the Earth system, by examining a time series of environmental data maps. Each team examines a single variable displayed on a global data map, and identify the unit of measure, the range of values, and patterns they observe in the data. Variables include: insolation, surface temperature, precipitation, cloud fraction, aerosols, biopshere. This is one of six interrelated learning activities associated with the GLOBE Earth System Poster, "Exploring Connections in Year 2007," and includes a series of assessment and extension activities. GLOBE (Global Learning and Observation to Benefit the Environment) is a worldwide, hands-on, K-12 school-based science education program.
This book introduces students to some of the most unusual places in …
This book introduces students to some of the most unusual places in our galaxy outside of our solar system. Answering the question, "How many stars are in the sky?" introduces students to basic counting, tallying, and grouping techniques, as well as allowing for the use of simple proportions.
Students will explore time series plots and raw data to understand the …
Students will explore time series plots and raw data to understand the role of sea surface temperature increases on arctic ice melt. This is part three of a four-part activity on polar science. The activity builds on the knowledge gained in Using Data and Images to Understand Albedo (part 2). Extension activities examining air and sea surface temperature in relation to changing Earth albedo are included. Information is provided on data access using the NOAA Earth System Research Laboratory Web site. This activity is one of several learning activities connected with the 2007 GLOBE Earth system poster.
In this problem set, learners will analyze an image of Washington, DC, …
In this problem set, learners will analyze an image of Washington, DC, taken from orbit. They will determine scale and take measurements of several features in the image. A link to more images taken from the International Space Station and the answer key are provided. This is part of Earth Math: A Brief Mathematical Guide to Earth Science and Climate Change.
As science extension activities, this book of problems introduces students to mapping …
As science extension activities, this book of problems introduces students to mapping the shape of the Milky Way galaxy, and how to identify the various kinds of galaxies in our universe. Students also learn about the shapes and sizes of other galaxies in our universe as they learn how to classify them. The math problems cover basic scientific notation skills and how they apply to working with astronomically large numbers. It also provides exercises in plotting points on a Cartesian plane to map the various features of our Milky Way.
This is an activity about the solar activity cycle. Learners will construct …
This is an activity about the solar activity cycle. Learners will construct a graph to identify a pattern of the number of observed sunspots and the number of coronal mass ejections emitted by the Sun over a fifteen year time span. A graphing calculator is recommended, but not required, for this activity. This is the second activity in the Solar Storms and You: Exploring the Wind from the Sun educator guide.
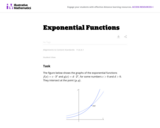
In this task students prove that linear functions grow by equal differences …
In this task students prove that linear functions grow by equal differences over equal intervals, and that exponential functions grow by equal factors over equal intervals.
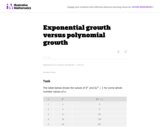
In this task students observe using graphs and tables that a quantity …
In this task students observe using graphs and tables that a quantity increasing exponentially eventually exceeds a quantity increasing linearly, quadratically, or (more generally) as a polynomial function.
In this activity, students use base-two slide rules, log tapes, and calculators …
In this activity, students use base-two slide rules, log tapes, and calculators to practice raising exponents in base notation and pulling down exponents in log notation. Students will develop an understanding that antilog notation expresses the exact same idea as raising a base to a power.åÊThis activity is activity C2 in the "Far Out Math" educator's guide. Lessons in the guide include activities in which students measure, compare quantities as orders of magnitude, become familiar with scientific notation, and develop an understanding of exponents and logarithms using examples from NASA's GLAST mission. These are skills needed to understand the very large and very small quantities characteristic of astronomical observations. Note: In 2008, GLAST was renamed Fermi, for the physicist Enrico Fermi.
The purpose of this task is to help students see the "why" …
The purpose of this task is to help students see the "why" behind properties of logs that are familiar but often just memorized (and quickly forgotten or misremembered). The task focuses on the verbal definition of the log, helping students to concentrate on understanding that a logarithm is an exponent, as opposed to completing a more computational approach.
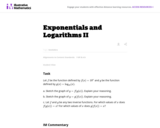
This task and its companion, F-BF Exponentials and Logarithms I, is designed …
This task and its companion, F-BF Exponentials and Logarithms I, is designed to help students gain facility with properties of exponential and logarithm functions resulting from the fact that they are inverses.
No restrictions on your remixing, redistributing, or making derivative works. Give credit to the author, as required.
Your remixing, redistributing, or making derivatives works comes with some restrictions, including how it is shared.
Your redistributing comes with some restrictions. Do not remix or make derivative works.
Most restrictive license type. Prohibits most uses, sharing, and any changes.
Copyrighted materials, available under Fair Use and the TEACH Act for US-based educators, or other custom arrangements. Go to the resource provider to see their individual restrictions.