Students build and use a very basic Coulter electric sensing zone particle …
Students build and use a very basic Coulter electric sensing zone particle counter to count an unknown number of particles in a sample of "paint" to determine if enough particles per ml of "paint" exist to meet a quality standard. In a lab experiment, student teams each build an apparatus and circuit, set up data acquisition equipment, make a salt-soap solution, test liquid flow in the apparatus, take data, and make graphs to count particles.
Slow Reveal Graph (#slowrevealgraph) is an instructional routine that promotes sensemaking about …
Slow Reveal Graph (#slowrevealgraph) is an instructional routine that promotes sensemaking about data. This highly engaging routine uses scaffolded visuals and discourse to help students (in K-12 and beyond) make sense of data. As more and more of the graph is revealed, students refine their interpretation and construct meaning, often in surprising ways. This routine increases access for students without sacrificing rigor or engagement.
You will find all types of graphs for all ages of learners from elementary to high school.
Here are the steps: - It starts with a graph that has been stripped of context: its numbers, its labels, its title. - The teacher facilitates a discussion around what students notice and wonder. (The slides give discussion suggestions) - Then another slide is revealed. - Students identify what information is new. - Then another slide is revealed. - Again, students identify what information is new (the title) and discuss how this changes their understanding of the graph. - As more slides are added, more insight into this data representation is revealed.
The introductory page for the graph also offers more information about the context for this graph, other content connections, and paired texts for students to explore.
Webmath is a math-help web site that generates answers to specific math …
Webmath is a math-help web site that generates answers to specific math questions and problems, as entered by a user, at any particular moment. The math answers are generated and displayed real-time, at the moment a web user types in their math problem and clicks "solve." In addition to the answers, Webmath also shows the student how to arrive at the answer.
Students apply pre-requisite statistics knowledge and concepts learned in an associated lesson …
Students apply pre-requisite statistics knowledge and concepts learned in an associated lesson to a real-world state-of-the-art research problem that asks them to quantitatively analyze the effectiveness of different cracked steel repair methods. As if they are civil engineers, students statistically analyze and compare 12 sets of experimental data from seven research centers around the world using measurements of central tendency, five-number summaries, box-and-whisker plots and bar graphs. The data consists of the results from carbon-fiber-reinforced polymer patched and unpatched cracked steel specimens tested under the same stress conditions. Based on their findings, students determine the most effective cracked steel repair method, create a report, and present their results, conclusions and recommended methods to the class as if they were presenting to the mayor and city council. This activity and its associated lesson are suitable for use during the last six weeks of the AP Statistics course; see the topics and timing note for details.
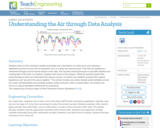
Students build on their existing air quality knowledge and a description of …
Students build on their existing air quality knowledge and a description of a data set to each develop a hypothesis around how and why air pollutants vary on a daily and seasonal basis. Then they are guided by a worksheet through an Excel-based analysis of the data. This includes entering formulas to calculate statistics and creating plots of the data. As students complete each phase of the analysis, reflection questions guide their understanding of what new information the analysis reveals. At activity end, students evaluate their original hypotheses and “put all of the pieces together.” The activity includes one carbon dioxide worksheet/data set and one ozone worksheet/data set; providing students and/or instructors with a content option. The activity also serves as a good standalone introduction to using Excel.
Prepared with pre-algebra or algebra 1 classes in mind, this module leads …
Prepared with pre-algebra or algebra 1 classes in mind, this module leads students through the process of graphing data and finding a line of best fit while exploring the characteristics of linear equations in algebraic and graphic formats. Then, these topics are connected to real-world experiences in which people use linear functions. During the module, students use these scientific concepts to solve the following hypothetical challenge: You are a new researcher in a lab, and your boss has just given you your first task to analyze a set of data. It being your first assignment, you ask an undergraduate student working in your lab to help you figure it out. She responds that you must determine what the data represents and then find an equation that models the data. You believe that you will be able to determine what the data represents on your own, but you ask for further help modeling the data. In response, she says she is not completely sure how to do it, but gives a list of equations that may fit the data. This module is built around the legacy cycle, a format that incorporates educational research feindings on how people best learn.
No restrictions on your remixing, redistributing, or making derivative works. Give credit to the author, as required.
Your remixing, redistributing, or making derivatives works comes with some restrictions, including how it is shared.
Your redistributing comes with some restrictions. Do not remix or make derivative works.
Most restrictive license type. Prohibits most uses, sharing, and any changes.
Copyrighted materials, available under Fair Use and the TEACH Act for US-based educators, or other custom arrangements. Go to the resource provider to see their individual restrictions.