September is a great time for data collection activities as students are …
September is a great time for data collection activities as students are naturally curious about their new classmates. Ask questions that require students to analyze data and support their conclusions.
Before completing this assignment, the students must work through their outcome-based work …
Before completing this assignment, the students must work through their outcome-based work booklets in order to gain some background information on graphs. The booklets include mini assignments from the Math Makes Sense textbook and other digital resources.
This 10-day module builds on Grade 2 concepts about data, graphing, and …
This 10-day module builds on Grade 2 concepts about data, graphing, and line plots. The two topics in this module focus on generating and analyzing categorical and measurement data. By the end of the module, students are working with a mixture of scaled picture graphs, bar graphs, and line plots to problem solve using both categorical and measurement data.
Find the rest of the EngageNY Mathematics resources at https://archive.org/details/engageny-mathematics.
This task adds some rigor to the activity of growing bean plants. …
This task adds some rigor to the activity of growing bean plants. By collecting growth data, students practice measuring and recording length measurements.
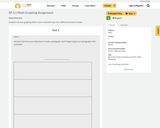
In this task students figure out how to draw the longest line …
In this task students figure out how to draw the longest line on a map of the United States without hitting a border. They use color and line plots to keep track of their results.
This site uses American standards, so filter by SKILL, not grade to …
This site uses American standards, so filter by SKILL, not grade to find what you need.
This site allows you to differentiate for a wide variety of needs quickly!
Create activities for PAPER or ONLINE learning. This can be used in the classroom and for distance learning. *daily review creator! *create mixed or spiral reviews to foster mastery *create practice pages to reinforce skills *print cheat sheets to explain skills to students *create flashcards for review *create modified versions of activities *create quizzes *multiple languages available *drills
*make your own spelling lists using word families or use pre-made lists
(Nota: Esta es una traducción de un recurso educativo abierto creado por …
(Nota: Esta es una traducción de un recurso educativo abierto creado por el Departamento de Educación del Estado de Nueva York (NYSED) como parte del proyecto "EngageNY" en 2013. Aunque el recurso real fue traducido por personas, la siguiente descripción se tradujo del inglés original usando Google Translate para ayudar a los usuarios potenciales a decidir si se adapta a sus necesidades y puede contener errores gramaticales o lingüísticos. La descripción original en inglés también se proporciona a continuación.)
Este módulo de 10 días se basa en conceptos de grado 2 sobre datos, gráficos y parcelas de línea. Los dos temas en este módulo se centran en generar y analizar datos categóricos y de medición. Al final del módulo, los estudiantes están trabajando con una mezcla de gráficos de imágenes escalados, gráficos de barras y gráficos de línea para resolver problemas utilizando datos categóricos y de medición.
Encuentre el resto de los recursos matemáticos de Engageny en https://archive.org/details/engageny-mathematics.
English Description: This 10-day module builds on Grade 2 concepts about data, graphing, and line plots. The two topics in this module focus on generating and analyzing categorical and measurement data. By the end of the module, students are working with a mixture of scaled picture graphs, bar graphs, and line plots to problem solve using both categorical and measurement data.
Find the rest of the EngageNY Mathematics resources at https://archive.org/details/engageny-mathematics.
Slow Reveal Graph (#slowrevealgraph) is an instructional routine that promotes sensemaking about …
Slow Reveal Graph (#slowrevealgraph) is an instructional routine that promotes sensemaking about data. This highly engaging routine uses scaffolded visuals and discourse to help students (in K-12 and beyond) make sense of data. As more and more of the graph is revealed, students refine their interpretation and construct meaning, often in surprising ways. This routine increases access for students without sacrificing rigor or engagement.
You will find all types of graphs for all ages of learners from elementary to high school.
Here are the steps: - It starts with a graph that has been stripped of context: its numbers, its labels, its title. - The teacher facilitates a discussion around what students notice and wonder. (The slides give discussion suggestions) - Then another slide is revealed. - Students identify what information is new. - Then another slide is revealed. - Again, students identify what information is new (the title) and discuss how this changes their understanding of the graph. - As more slides are added, more insight into this data representation is revealed.
The introductory page for the graph also offers more information about the context for this graph, other content connections, and paired texts for students to explore.
No restrictions on your remixing, redistributing, or making derivative works. Give credit to the author, as required.
Your remixing, redistributing, or making derivatives works comes with some restrictions, including how it is shared.
Your redistributing comes with some restrictions. Do not remix or make derivative works.
Most restrictive license type. Prohibits most uses, sharing, and any changes.
Copyrighted materials, available under Fair Use and the TEACH Act for US-based educators, or other custom arrangements. Go to the resource provider to see their individual restrictions.