Three varios tools to help students analyze and/or retell what they have read.
- Author:
- Sun West School Division
- Date Added:
- 05/08/2018

Three varios tools to help students analyze and/or retell what they have read.

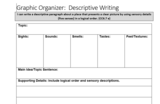
This graphic organizer helps writers to write a descriptive paragraph by focusing on sights, smells, tastes, sounds, and touch.

Options include:
Two-Circle Venn
Three-Circle Venn
Scale Timeline
Thought Web Cluster
Fact vs. Opinion
Five W's
Pros-Cons Flowchart
KWHL KWL
Idea Funnel Cycle
Scientific Method

Free collection of TONS of graphic organizers.

Over 100 free, printable graphic organizers for a wide variety of topics.

Graphic Organizers to Help Kids With Math

Graphic Organizers to Help Kids with Reading

Today, we're going to discuss the critical role graphical user interfaces, or GUIs played in the adoption of computers. Before the mid 1980's the most common way people could interact with their devices was through command line interfaces, which though efficient, aren't really designed for casual users. This all changed with the introduction of the Macintosh by Apple in 1984. It was the first mainstream computer to use a GUI, standing on the shoulder of nearly two decades of innovation including work from the father of the GUI himself, Douglas Englebart, and some amazing breakthroughs at Xerox Parc.

A free online way to build graphs on a coordinate plane.

Students learn about an important characteristic of lines: their slopes. Slope can be determined either in graphical or algebraic form. Slope can also be described as positive, negative, zero or undefined. Students get an explanation of when and how these different types of slope occur. Finally, they learn how slope relates to parallel and perpendicular lines. When two lines are parallel, they have the same slope and when they are perpendicular their slopes are negative reciprocals of one another.

The students will be able to identify questions and concepts in the ability to construct accurate graphs, recognize and analyze alternative explanations and models by the end of this activity.

Rebecca Davis sets up a coordinate plane on the floor of her classroom. Groups of 3 or 4 students are assigned equations in slope-intercept form and graph them using their bodies on the giant coordinate plane. As extensions, Ms. Davis changes the slope or y-intercept of the original equation and makes the activity into a race.

Give students the graphing template.
Play any of the videos.
Have students graph the story!
Types of graphing includes: constant, decreasing, increasing, linear, parabolic, periodic, piecewise, step.

Students analyze their social networks using graph theory. They gather data on their own social relationships, either from Facebook interactions or the interactions they have throughout the course of a day, recording it in Microsoft Excel and using Cytoscape (a free, downloadable application) to generate social network graphs that visually illustrate the key persons (nodes) and connections between them (edges). The nodes in the Cytoscape graphs are color-coded and sized according to the importance of the node (in this activity, nodes are people in students' social networks). After the analysis, the graphs are further examined to see what can be learned from the visual representation. Students gain practice with graph theory vocabulary, including node, edge, betweeness centrality and degree on interaction, and learn about a range of engineering applications of graph theory.

This is an activity about the relation between day length and temperature. In one team, learners will create and analyze a graph of hours of sunlight versus month of the year for a number of latitudes. In another team, learners will graph temperature versus month for the same latitudes. The teams then compare data and draw conclusions from their analyses.

This is a lesson about visual spectra. Learners will explore different ways of displaying visual spectra, including colored "barcode" spectra, like those produced by a diffraction grating, and line plots displaying intensity versus color, or wavelength. Students learn that a diffraction grating acts like a prism, bending light into its component colors. The activity is part of Project Spectra, a science and engineering program for middle-high school students, focusing on how light is used to explore the Solar System.

Students are introduced to different ways of displaying visual spectra, including colored "barcode" spectra, like those produced by a diffraction grating, and line plots displaying intensity versus color, or wavelength. Students learn that a diffraction grating acts like a prism, bending light into its component colors.

Students simulate disease transmission by collecting data based on their proximity to other students. One option for measuring proximity is by having Bluetooth devices "discover" each other. After data is collected, students apply graph theory to analyze it, and summarize their data and findings in lab report format. Students learn real-world engineering applications of graph theory and see how numerous instances of real-world relationships can be more thoroughly understood by applying graph theory. Also, by applying graph theory the students are able to come up with possible solutions to limit the spread of disease. The activity is intended to be part of a computer science curriculum and knowledge of the Java programming language is required. To complete the activity, a computer with Java installed and appropriate editing software is needed.

Graphing to Connect the Dots activity for Grades 6 and 7.

Students examine their schoolyard for litter and graph its spread. Using TIGed Collaborations, your students can share their results with other students around the world and discuss what the causes might be for any differences.