Students engage in hands-on, true-to-life research experiences on air quality topics chosen …
Students engage in hands-on, true-to-life research experiences on air quality topics chosen for personal interest through a unit composed of one lesson and five associated activities. Using a project-based learning approach suitable for secondary science classrooms and low-cost air quality monitors, students gain the background and skills needed to conduct their own air quality research projects. The curriculum provides: 1) an introduction to air quality science, 2) data collection practice, 3) data analysis practice, 4) help planning and conducting a research project and 5) guidance in interpreting data and presenting research in professional poster format. The comprehensive curriculum requires no pre-requisite knowledge of air quality science or engineering. This curriculum takes advantage of low-cost, next-generation, open-source air quality monitors called Pods. These monitors were developed in a mechanical engineering lab at the University of Colorado Boulder and are used for academic research as well as education and outreach. The monitors are made available for use with this curriculum through AQ-IQ Kits that may be rented from the university by teachers. Alternatively, nearly the entire unit, including the student-directed projects, could also be completed without an air quality monitor. For example, students can design research projects that utilize existing air quality data instead of collecting their own, which is highly feasible since much data is publically available. In addition, other low-cost monitors could be used instead of the Pods. Also, the curriculum is intentionally flexible, so that the lesson and its activities can be used individually. See the Other section for details about the Pods and ideas for alternative equipment, usage without air quality monitors, and adjustments to individually teach the lesson and activities.
Students prepare for the associated activity in which they investigate acceleration by …
Students prepare for the associated activity in which they investigate acceleration by collecting acceleration vs. time data using the accelerometer of a sliding Android device. Based on the experimental set-up for the activity, students form hypotheses about the acceleration of the device. Students will investigate how the force on the device changes according to Newton's Second Law. Different types of acceleration, including average, instantaneous and constant acceleration, are introduced. Acceleration and force is described mathematically and in terms of processes and applications.
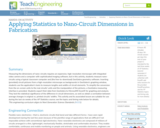
Measuring the dimensions of nano-circuits requires an expensive, high-resolution microscope with integrated …
Measuring the dimensions of nano-circuits requires an expensive, high-resolution microscope with integrated video camera and a computer with sophisticated imaging software, but in this activity, students measure nano-circuits using a typical classroom computer and (the free-to-download) GeoGebra geometry software. Inserting (provided) circuit pictures from a high-resolution microscope as backgrounds in GeoGebra's graphing window, students use the application's tools to measure lengths and widths of circuit elements. To simplify the conversion from the on-screen units to the real circuits' units and the manipulation of the pictures, a GeoGebra measuring interface is provided. Students export their data from GeoGebra to Microsoft® Excel® for graphing and analysis. They test the statistical significance of the difference in circuit dimensions, as well as obtain a correlation between average changes in original vs. printed circuits' widths. This activity and its associated lesson are suitable for use during the last six weeks of the AP Statistics course; see the topics and timing note below for details.
With ArcGIS Online, you can create, analyse, and communicate data through maps, …
With ArcGIS Online, you can create, analyse, and communicate data through maps, graphs and stories. Understand where and why things occur. In 2021, the Saskatchewan Teachers' Federation and Ministry of Education approved ArcGIS Online as a teaching tool.
Students groups create scientific research posters to professionally present the results of …
Students groups create scientific research posters to professionally present the results of their AQ-IQ research projects, which serves as a conclusion to the unit. (This activity is also suitable to be conducted independently from its unit—for students to make posters for any type of project they have completed.) First, students critically examine example posters to gain an understanding of what they contain and how they can be made most effective for viewers. Then they are prompted to analyze and interpret their data, including what statistics and plots to use in their posters. Finally, groups are given a guide that aids them in making their posters by suggesting all the key components one would find in any research paper or presentation. This activity is suitable for presenting final project posters to classmates or to a wider audience in a symposium or expo environment. In addition to the poster-making guide, three worksheets, six example posters, a rubric and a post-unit survey are provided.
Included are the support materials for Grade 2 Blended Learning Math - …
Included are the support materials for Grade 2 Blended Learning Math - Unit 7.0: Data Analysis - Introduction: - YouTube video on developing sorting rules to create and understand different types of graphs - Manipulatives and Templates to support Unit 7 - Assessment and Evaluation for Unit 7
Included are the support materials for Grade 2 Blended Learning Math - …
Included are the support materials for Grade 2 Blended Learning Math - Unit 7.1: Data Analysis - Concrete Graphs: - YouTube video on creating concrete graphs - Manipulatives and Templates to support Unit 7 - Assessment and Evaluation for Unit 7
Included are the support materials for Grade 2 Blended Learning Math - …
Included are the support materials for Grade 2 Blended Learning Math - Unit 7.3: Data Analysis - Labeling Concrete Graphs: - YouTube video on labeling concrete graphs - Manipulatives and Templates to support Unit 7 - Assessment and Evaluation for Unit 7
Included are the support materials for Grade 2 Blended Learning Math - …
Included are the support materials for Grade 2 Blended Learning Math - Unit 7.3: Data Analysis - Pictographs: - YouTube video on creating and understanding pictographs - Manipulatives and Templates to support Unit 7 - Assessment and Evaluation for Unit 7
Included are the support materials for Grade 2 Blended Learning Math - …
Included are the support materials for Grade 2 Blended Learning Math - Unit 7.4: Data Analysis - Creating Pictographs: - YouTube video on creating pictographs - Manipulatives and Templates to support Unit 7 - Assessment and Evaluation for Unit 7
Included are the support materials for Grade 2 Blended Learning Math - …
Included are the support materials for Grade 2 Blended Learning Math - Unit 7.5: Data Analysis - Pictograph Problem Solving: - YouTube video on solving problems using a pictograph and tally marks - Manipulatives and Templates to support Unit 7 - Assessment and Evaluation for Unit 7
Included are the support materials for Grade 2 Blended Learning Math - …
Included are the support materials for Grade 2 Blended Learning Math - Unit 7.6: Data Analysis - Surveying and Recording Data: - YouTube video on recording data from a survey using check marks and tally marks - Manipulatives and Templates to support Unit 7 - Assessment and Evaluation for Unit 7
Included are the support materials for Grade 2 Blended Learning Math - …
Included are the support materials for Grade 2 Blended Learning Math - Unit 7.7: Data Analysis - Using Data to Create Lists, Charts and Graphs: - YouTube video on using data to create lists, chars and graphs - Manipulatives and Templates to support Unit 7 - Assessment and Evaluation for Unit 7
Included are the support materials for Grade 2 Blended Learning Math - …
Included are the support materials for Grade 2 Blended Learning Math - Unit 7.8: Data Analysis - Review: - YouTube video reviewing the unit on data analysis plus a bonus video on planning a birthday bash - Manipulatives and Templates to support Unit 7 - Assessment and Evaluation for Unit 7
No restrictions on your remixing, redistributing, or making derivative works. Give credit to the author, as required.
Your remixing, redistributing, or making derivatives works comes with some restrictions, including how it is shared.
Your redistributing comes with some restrictions. Do not remix or make derivative works.
Most restrictive license type. Prohibits most uses, sharing, and any changes.
Copyrighted materials, available under Fair Use and the TEACH Act for US-based educators, or other custom arrangements. Go to the resource provider to see their individual restrictions.