Updating search results...

Search Resources

54 Results

View
Selected filters:
  • data-analysis
DLC Blended Learning Math 4 - Unit 8.1: Data Analysis - Reading Pictographs and Bar Graphs
Conditional Remix & Share Permitted
CC BY-NC-SA
Rating
0.0 stars

The purpose of this lesson is to read and interpret pictographs and bar graphs using many one-to-one correspondence.

Included is a YouTube video to support Grade 4 Blended Learning Math - Unit 8.1: Data Analysis - Reading Pictographs and Bar Graphs.

Subject:
Math
Material Type:
Activity/Lab
Homework/Assignment
Lesson
Provider:
Sun West Distance Learning Centre (DLC)
Date Added:
04/25/2019
DLC Blended Learning Math 4 - Unit 8.2: Data Analysis - Drawing Pictographs
Conditional Remix & Share Permitted
CC BY-NC-SA
Rating
0.0 stars

The purpose of this lesson is to construct and interpret pictographs involving many one-to-one correspondence to draw conclusions.

Included is a YouTube video to support Grade 4 Blended Learning Math - Unit 8.2: Data Analysis - Drawing Pictographs.

Subject:
Math
Material Type:
Activity/Lab
Homework/Assignment
Lesson
Provider:
Sun West Distance Learning Centre (DLC)
Date Added:
04/25/2019
DLC Blended Learning Math 4 - Unit 8.3: Data Analysis - Drawing Bar Graphs
Conditional Remix & Share Permitted
CC BY-NC-SA
Rating
0.0 stars

The purpose of this lesson is to construct and interpret bar graphs involving many one-to-one correspondence to draw conclusions.

Included is a YouTube video to support Grade 4 Blended Learning Math - Unit 8.3: Data Analysis - Drawing Bar Graphs.

Subject:
Math
Material Type:
Activity/Lab
Homework/Assignment
Lesson
Provider:
Sun West Distance Learning Centre (DLC)
Date Added:
04/25/2019
DLC Blended Learning Math 4 - Unit 8.4: Data Analysis - Comparing Pictographs to Bar Graphs
Conditional Remix & Share Permitted
CC BY-NC-SA
Rating
0.0 stars

The purpose of this lesson is to interpret pictographs and bar graphs involving many one-to-one correspondence to draw conclusions.

Included is a YouTube video to support Grade 4 Blended Learning Math - Unit 8.4: Data Analysis - Comparing Pictographs to Bar Graphs.

Subject:
Math
Material Type:
Activity/Lab
Homework/Assignment
Lesson
Provider:
Sun West Distance Learning Centre (DLC)
Date Added:
04/25/2019
DLC Blended Learning Math 7 - Unit 7.1: Data Analysis - Mean and Mode
Conditional Remix & Share Permitted
CC BY-NC-SA
Rating
0.0 stars

The purpose of this lesson is to learn how to find the mean and the mode of a data set.

Included is a YouTube video to support Grade 7 Blended Learning Math - Unit 7.1: Data Analysis - Mean and Mode.

Subject:
Math
Material Type:
Activity/Lab
Homework/Assignment
Lesson
Provider:
Sun West Distance Learning Centre (DLC)
Date Added:
06/12/2019
DLC Blended Learning Math 7 - Unit 7.2: Data Analysis - Median and Range
Conditional Remix & Share Permitted
CC BY-NC-SA
Rating
0.0 stars

The purpose of this lesson is to learn how to find the median and range of a data set.

Included is a YouTube video to support Grade 7 Blended Learning Math - Unit 7.2: Data Analysis - Median and Range.

Subject:
Math
Material Type:
Activity/Lab
Homework/Assignment
Lesson
Provider:
Sun West Distance Learning Centre (DLC)
Date Added:
06/12/2019
DLC Blended Learning Math 7 - Unit 7.3: Data Analysis - The Affects of Outliers on Average
Conditional Remix & Share Permitted
CC BY-NC-SA
Rating
0.0 stars

The purpose of this lesson is to learn about outliers and the affect they have on averages.

Included is a YouTube video to support Grade 7 Blended Learning Math - Unit 7.3: Data Analysis - The Affects of Outliers on Average.

Subject:
Math
Material Type:
Activity/Lab
Homework/Assignment
Lesson
Provider:
Sun West Distance Learning Centre (DLC)
Date Added:
06/12/2019
DLC Blended Learning Math 7 - Unit 7.5: Data Analysis - Different Ways to Express Probability
Conditional Remix & Share Permitted
CC BY-NC-SA
Rating
0.0 stars

The purpose of this lesson is to learn how to express probabilities of events as ratios, fractions and percents.

Included is a YouTube video to support Grade 7 Blended Learning Math - Unit 7.5: Data Analysis - Different Ways to Express Probability.

Subject:
Math
Material Type:
Activity/Lab
Homework/Assignment
Lesson
Provider:
Sun West Distance Learning Centre (DLC)
Date Added:
06/12/2019
Data Analysis: Coin Flipping
Read the Fine Print
Rating
0.0 stars

Using two different coins and recording the results of both coins helps students dispel this initial misconception as they analyze the graph results. Class discussion should focus on analyzing the data to determine if the game is fair or not. Directions and gameboard are included in the download.

Subject:
Math
Material Type:
Game
Provider:
Mathwire
Author:
Terry Kawas
Date Added:
05/21/2018
Data Analysis and Probability Games
Read the Fine Print
Rating
0.0 stars

These activities support students as they conceptually develop a sense of how probability affects the outcome of games. Students will find that applying their knowledge of probability will help them win some of the games

Subject:
Math
Material Type:
Game
Provider:
Mathwire
Author:
Terry Kawas
Date Added:
05/21/2018
Exploring Acceleration with an Android
Read the Fine Print
Educational Use
Rating
0.0 stars

Students conduct an experiment to study the acceleration of a mobile Android device. During the experiment, they run an application created with MIT's App Inventor that monitors linear acceleration in one-dimension. Students use an acceleration vs. time equation to construct an approximate velocity vs. time graph. Students will understand the relationship between the object's mass and acceleration and how that relates to the force applied to the object, which is Newton's second law of motion.

Subject:
Computer Science
Science
Material Type:
Activity/Lab
Provider:
TeachEngineering
Provider Set:
TeachEngineering
Author:
Brian Sandall
Scott Burns
Date Added:
09/18/2014
Exploring Computer Science (Grades 9-10)
Conditional Remix & Share Permitted
CC BY-NC-SA
Rating
0.0 stars

Exploring Computer Science is a yearlong course developed around a framework of both computer science content and computational practice. Assignments and instruction are contextualized to be socially relevant and meaningful for diverse students. Units utilize a variety of tools/platforms and culminate with final projects around Human-Computer Interaction, Problem Solving, Web Design (HTML, CSS), Programming (Scratch, Edware), Computing & Data Analysis, and Robotics. ECS is recognized nationally as a preparatory course for AP Computer Science Principles. Watch this video and view this fact sheet for more information.

Subject:
Computer Science
Science
Material Type:
Unit of Study
Provider:
New York City Department of Education
Provider Set:
Computer Science for All
Date Added:
01/07/2019
Gait Analysis
Read the Fine Print
Educational Use
Rating
0.0 stars

In this open-ended, hands-on activity that provides practice in engineering data analysis, students are given gait signature metric (GSM) data for known people types (adults and children). Working in teams, they analyze the data and develop models that they believe represent the data. They test their models against similar, but unknown (to the students) data to see how accurate their models are in predicting adult vs. child human subjects given known GSM data. They manipulate and graph data in Excel® to conduct their analyses.

Subject:
Science
Material Type:
Activity/Lab
Provider:
TeachEngineering
Provider Set:
TeachEngineering
Author:
Brian Sandall
Jeremy Scheffler
Date Added:
10/14/2015
Gingerbread Man Math
Read the Fine Print
Rating
0.0 stars

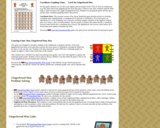
Gingerbread men and gingerbread houses enjoy special popularity around the holidays, but many of these gingerbread activities are timeless and complement literature titles that teachers use at the beginning of school or after the holidays. It's very easy to incorporate mathematics into a study of gingerbread men, and students will enjoy the data collection activities and games while learning math skills and deepening their understanding of important mathematical concepts. Look through these math activities and add some to your repertoire. Consider broadening the gingerbread math to include measurement, games and problem solving this year.

Subject:
Math
Material Type:
Activity/Lab
Game
Provider:
Mathwire
Author:
Terry Kawas
Date Added:
05/21/2018
Linear Regression of BMD Scanners
Read the Fine Print
Educational Use
Rating
0.0 stars

Students complete an exercise showing logarithmic relationships and examine how to find the linear regression of data that does not seem linear upon initial examination. They relate number of BMD scanners to time.

Subject:
Math
Material Type:
Activity/Lab
Provider:
TeachEngineering
Provider Set:
TeachEngineering
Author:
Kristyn Shaffer
Date Added:
09/18/2014
Math Templates for Spinners
Read the Fine Print
Rating
0.0 stars

Use the math templates below to create spinners for probability experiments. The templates are designed to be placed in sheet protectors. Students can then customize the spinner for the particular experiment or game. Tape a transparent spinner over top the spinner template for student use. This method allows teachers to create many different spinners using templates and the plastic transparent spinners that are commercially available. This is especially effective when students are designing their own games as they can customize one of the templates or design their own on the computer. The use of the transparent spinner is more reliable than the pencil and paper clip method often suggested as a cost-saving strategy.

Subject:
Math
Material Type:
Activity/Lab
Game
Provider:
Mathwire
Author:
Terry Kawas
Date Added:
05/21/2018
Means, Modes and Medians
Read the Fine Print
Educational Use
Rating
0.0 stars

Students experience data collection, analysis and inquiry in this LEGO® MINDSTORMS® NXT -based activity. They measure the position of an oscillating platform using a ultrasonic sensor and perform statistical analysis to determine the mean, mode, median, percent difference and percent error for the collected data.

Subject:
Math
Physics
Science
Material Type:
Activity/Lab
Provider:
TeachEngineering
Provider Set:
TeachEngineering
Author:
Irina Igel
Noam Pillischer
Ronald Poveda
Date Added:
09/18/2014
Modeling Hot and Cold Planets: Activity C Approximating the Average Surface Temperature of the Earth
Read the Fine Print
Rating
0.0 stars

In this activity, students explore the importance of adequate sampling strategies when conducting a scientific investigation. They are tasked with determining the average temperature of the Earth, using data sets easily found on the Internet, and determine the kind and size of sample necessary to calculate a representative average. The resource includes a student data sheet and an authentic assessment for the module, where students discuss the establishment of a habitation site on Mars. This is Activity C in module 2, titled "Modeling Hot and Cold Planets," of the resource, Earth Climate Course: What Determines a Planet's Climate? The course aims to help students to develop an understanding of our environment as a system of human and natural processes that result in changes that occur over various space and time scales.

Subject:
Math
Science
Material Type:
Activity/Lab
Provider:
NASA
Provider Set:
NASA Wavelength
Date Added:
10/05/2018