This is a general collection of math resources. It is a large collection, but you can use the fliters on the left side of the screen to filter down to the specific education level you are looking for. (You are encouraged to filter by education level, not grade.)
A web page and interactive applet showing the definition and properties of …
A web page and interactive applet showing the definition and properties of a parallelogram. The applet shows a parallelogram where the user can drag any vertex. The other points then move in such a way that the figure remains a parallelogram at all times. A control to hide the details allows a classroom discussion where students can try to infer what the properties are as it is reshaped by the discussion leader. Text on the page has the formal definition and properties of the parallelogram with links to related pages. A companion page is http://www.mathopenref.com/parallelogramarea.html showing the ways to calculate the area of a parallelogram Applet can be enlarged to full screen size for use with a classroom projector. This resource is a component of the Math Open Reference Interactive Geometry textbook project at http://www.mathopenref.com.
The purpose of this task is to investigate the meaning of the …
The purpose of this task is to investigate the meaning of the definition of function in a real-world context where the question of whether there is more than one output for a given input arises naturally. In more advanced courses this task could be used to investigate the question of whether a function has an inverse.
When a function depends on multiple independent variables, the curly-d symbol denotes …
When a function depends on multiple independent variables, the curly-d symbol denotes slopes calculated by jiggling only one independent variable at a time. This is a multivariable cousin to the derivative. We use this notation in future sections to keep track of how molecules are generated or degraded by different reactions.
The point of this task is to emphasize the grouping structure of …
The point of this task is to emphasize the grouping structure of the base-ten number system, and in particular the crucial fact that 10 tens make 1 hundred.
Patient Problem Solving is a method of solving problems that you don't …
Patient Problem Solving is a method of solving problems that you don't already know how to solve. You are required to ask questions in order to even start solving the problem. Sometimes those questions are asked of the teacher, sometimes other students, and sometimes Google. For example, students are asked to use a ticker tape timer to calculate their speed. First of all students (and maybe you as the teacher) need to figure out what a ticker tape timer does. There are a variety of ways to solve these problems, and creativity will help them get to an answer.
This is an activity about detecting elements by using light. Learners will …
This is an activity about detecting elements by using light. Learners will develop and apply methods to identify and interpret patterns to the identification of fingerprints. They look at fingerprints of their classmates, snowflakes, and finally ‰ÛÏspectral fingerprints‰Û� of elements. They learn to identify each image as unique, yet part of a group containing recognizable similarities. The activity is part of Project Spectra, a science and engineering program for middle-high school students, focusing on how light is used to explore the Solar System.
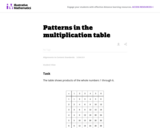
The goal of this task is to look for structure and identify …
The goal of this task is to look for structure and identify patterns and then try to find the mathematical explanation for this. This problem examines the ''checkerboard'' pattern of even and odd numbers in a single digit multiplication table.
Oceans play a significant role in determining and moderating the effects of …
Oceans play a significant role in determining and moderating the effects of energy imbalances. Students will begin this lesson by working with temperature data to reinforce the importance of protocols, practice computing statistical measures of data and interpreting their significance. The lesson continues with investigations into daily and annual energy cycles. Using a sea surface environment visualizer, students then identify patterns of sea surface current and temperature data. Note that this is lesson five of five on the Ocean Motion website. Each lesson investigates ocean surface circulation using satellite and model data and can be done independently. See Related URL's for links to the Ocean Motion Website that provide science background information, data resources, teacher material, student guides and a lesson matrix.
This task provides a context where it is appropriate for students to …
This task provides a context where it is appropriate for students to subtract fractions with a common denominator; it could be used for either assessment or instructional purposes.
This task allows students to reason about the relative costs per pound …
This task allows students to reason about the relative costs per pound of the two fruits without actually knowing what the costs are. Students who find this difficult may add a scale to the graph and reason about the meanings of the ordered pairs. Comparing the two approaches in a class discussion can be a profitable way to help students make sense of slope.
Navigate the number line while diving amidst shipwrecks and sunken ruins. Will …
Navigate the number line while diving amidst shipwrecks and sunken ruins. Will you find a pearl, or an old boot? Watch out for the electric eel! Pearl Diver teaches properties of numbers, how to plot numbers, how to visualize quantity on the number line, how to order numbers, and how to use the number line as a visual model for mathematical operations.
A web page and interactive applet illustrating the properties of a pentagon …
A web page and interactive applet illustrating the properties of a pentagon (5 sided polygon). The applet shows a pentagon where the user can drag any vertex to reshape it. User can see that the interior and exterior angles are constant in a regular pentagon, but vary in an irregular version. Controls allow the display or hiding of the diagonals, and triangles within the pentagon. The web page lists the properties of a pentagon including interior angles, exterior angles, sum of exterior angles, area, number of diagonals and number of internal triangles. Links to pages with generalized properties of all polygons. Applet can be enlarged to full screen size for use with a classroom projector. This resource is a component of the Math Open Reference Interactive Geometry textbook project at http://www.mathopenref.com.
No restrictions on your remixing, redistributing, or making derivative works. Give credit to the author, as required.
Your remixing, redistributing, or making derivatives works comes with some restrictions, including how it is shared.
Your redistributing comes with some restrictions. Do not remix or make derivative works.
Most restrictive license type. Prohibits most uses, sharing, and any changes.
Copyrighted materials, available under Fair Use and the TEACH Act for US-based educators, or other custom arrangements. Go to the resource provider to see their individual restrictions.