It is finally time for students to take on the Explore Performance …
It is finally time for students to take on the Explore Performance Task. For a minimum of 8 class hours, students should work on their projects with only types of teacher support allowed (essentially: Advise on process, don’t influence or evaluate ideas).
The lesson includes reminders about how you can interact with students while they are working on their projects, and suggestions about time line. The Explore PT requires a minimum of 8 hours of class time. At the end, students will submit their computational artifact and written responses through their AP digital portfolio.
This lesson contains a series of activities you can use to help …
This lesson contains a series of activities you can use to help students familiarize themselves with Create Performance Task, how it is scored, and some example tasks provided by the College Board.
Students review the Submission Requirements and Scoring Guidelines for the Create PT. Subsequently they review three example scored Create PT submissions with commentary to better understand how the Submission Requirements and Scoring Guidelines are used together. In a wrap-up conversation they identify a piece of advice, a "gotcha", and a remaining question they have about the Create PT.
Note: Much the sample tasks, scores, and commentary on scoring shared in this lesson come directly from the College Board. Code.org's commentary is noted where applicable.
This lesson uses the [r create-pt-survival-guide] as the backbone for a series …
This lesson uses the [r create-pt-survival-guide] as the backbone for a series of activities to ramp up to doing the actual Create PT. It contains activities to help students understand the algorithm and abstraction requirements of the task, as well as activities to help them narrow down and brainstorm ideas for their actual project.
The lesson concludes by providing students with resources to make a plan to complete the task staring in the next lesson.
It is finally time for students to take on the Create Performance …
It is finally time for students to take on the Create Performance Task. For a total of 12 class hours, students should work on their projects with only types of teacher support allowed (essentially: Advise on process, don’t influence or evaluate ideas). Students may also work with a collaborative partner in *in development of their program* - written responses must be done on their own.
The lesson includes reminders about how you can interact with students while they are working on their projects, and suggestions about time line. The Create PT requires a minimum of 12 hours of class time. At the end, students will submit their program code, program video, and written responses through their AP digital portfolio.
In this kickoff to the Data Unit, students begin thinking about how …
In this kickoff to the Data Unit, students begin thinking about how data is collected and what can be learned from it. To begin the lesson, students will take a short online quiz that supposedly determines something interesting or funny about their personality. Afterwards they will brainstorm other sources of data in the world around them, leading to a discussion of how that data is collected. This discussion motivates the introduction of the Class Data Tracker project that will run through the second half of this unit. Students will take the survey for the first time and be shown what the results will look like. To close the class, students will make predictions of what they will find when all the data has been collected in a couple weeks.
This is a pretty fun lesson that has two main parts. First …
This is a pretty fun lesson that has two main parts. First students warm up by reflecting on the reasons data visualizations are used to communicate about data. This leads to the main activity in which students look at some collections of (mostly bad) data visualizations, rate them, explain why a good one is effective, and also suggest a fix for a bad one.
In the second part of class students compare their experiences and create a class list of common faults and best practices for creating data visualizations. Finally, students review and read the first few pages of **Data Visualization 101: How to design charts and graphs** to see some basic principles of good data visualizations and see how they compare with the list the class came up with.
Now that students have had the chance to see and evaluate various …
Now that students have had the chance to see and evaluate various data visualizations, they will learn to make visualizations of their own. This lesson teaches students how to build visualizations from provided datasets. The levels in Code Studio provide a detailed walkthrough of how to use Google Sheets to create several different kinds of charts. While this lesson focuses on the Google Sheets tool, other tools may be substituted at the teacher’s discretion, and MS Excel support is coming soon to the lesson.
The main activity teaches students to build different chart types (scatter, line, and bar charts) from a single data set. It should be emphasized to students that the purpose of this lesson is to explore and experiment with creating different types of visualizations, not to build the perfect chart. Students will have a chance to create and customize their own charts. At the end of class, students compare their custom visualizations with those of their classmates.
In this lesson, students will collaboratively investigate some datasets and use visualization …
In this lesson, students will collaboratively investigate some datasets and use visualization tools to “discover a data story.” The lesson assumes that students know how to use some kind of visualization tool - in the previous lesson we used the charting tools of a basic spreadsheet program. Students should be working with a partner but without much teacher hand-holding. Most of the time should be spent with students poking around the data and trying to discover connections and trends using data visualization tools. It is up to them to discover a trend, make a chart, and accurately write about it.
In this lesson, students begin working with the data that they have …
In this lesson, students begin working with the data that they have been collecting since the first lesson of the chapter in the class "data tracker." They are introduced to the first step in analyzing data: cleaning the data. Students will follow a guide in Code Studio, which demonstrates the common techniques of filtering and sorting data to familiarize themselves with its contents. Then they will correct errors they find in the data by either hand-correcting invalid values or deleting them. Finally they will categorize any free-text columns that were collected to prepare them for analysis. This lesson introduces many new skills with spreadsheets and reveals the sometimes subjective nature of data analysis.
In this lesson students learn how create their own summary tables from …
In this lesson students learn how create their own summary tables from raw data. A summary table typically represents one or more aggregations (groupings of items) and computations that are performed on the raw dataset. In most spreadsheet programs, a summary table is called a pivot table. In the lesson, students learn how to make pivot tables in Google Sheets using a provided dataset. Then students turn to the data they’ve collected as a class and, with their partner, use pivot tables to investigate it further.
For this Practice PT students will analyze the data that they have …
For this Practice PT students will analyze the data that they have been collecting as a class in order to demonstrate their ability to discover, visualize, and present a trend or pattern they find in the data. Leading up to this lesson, students will have been working in pairs to clean and summarize their data. Students should complete this project individually but can get feedback on their ideas from their data-cleaning partner.
**Note**: This is NOT the official AP® Performance Task that will be submitted as part of the Advanced Placement exam; it is a practice activity intended to prepare students for some portions of their individual performance at a later time.
Become a detective to solve the case of the smelly backpack! Act …
Become a detective to solve the case of the smelly backpack! Act out the clues and draw conclusions to solve the mystery.
When Detective Bentley cannot figure out why his backpack is smelly, he retraces the events in his day to find clues. Taking on the role of detectives, the viewers act out the events of Bentley’s day and use textual clues to solve the case.
Learning Objective: Draw conclusions from the facts presented in text and support those assertions with textual evidence.
Be a change maker; design solutions. The next generation of problem-solvers need …
Be a change maker; design solutions.
The next generation of problem-solvers need more than technical skills and expertise. They need experiences that allow them to see the designed world and its impact on people, collaborate and empathize across differences, and leverage their skills to redesign the world around them to meet the needs of all people in their communities.
This website has various video challenges with accompanying PDF's for student use …
This website has various video challenges with accompanying PDF's for student use . Students are able to post their own videos of how they solved the challenge, and take a look at how others solved it as well.
The ComPADRE Digital Library is a network of free online resource collections …
The ComPADRE Digital Library is a network of free online resource collections supporting faculty, students, and teachers in Physics and Astronomy Education. Each collection contains materials designed for a specific community.
Select teaching resources to start exploring. Also select resources from the top menu to find more options - including for students.
"A Wonderville quick tips video on computational thinking. In this video, learn …
"A Wonderville quick tips video on computational thinking.
In this video, learn about how to introduce coding and programming into your class by first adopting computational thinking practices. Discover what computational thinking is, it's benefits for your students, and examples that can give them the opportunity to practice this mindset and skill through exact instructions activities.
For more STEM related videos, games, and activities, head to: http://wonderville.org
And check out our other professional learning videos at: https://wonderville.org/professional-...
Related exact instruction challenge videos found here : How to put on winter clothes- https://youtu.be/LquWGTgRS7U How to draw a butterfly- https://youtu.be/5ttqUx5KS9A "
Using books by Ezra Jack Keats as inspiration, students explore problems and …
Using books by Ezra Jack Keats as inspiration, students explore problems and solutions through read-alouds, discussion, and an interactive bulletin board.
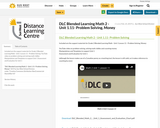
Included are the support materials for Grade 2 Blended Learning Math - …
Included are the support materials for Grade 2 Blended Learning Math - Unit 3.13: Problem Solving: - YouTube video on problem solving strategies for addition and subtraction to 18 - Manipulatives and Templates to support Unit 3 - Assessment and Evaluation for Unit 3
No restrictions on your remixing, redistributing, or making derivative works. Give credit to the author, as required.
Your remixing, redistributing, or making derivatives works comes with some restrictions, including how it is shared.
Your redistributing comes with some restrictions. Do not remix or make derivative works.
Most restrictive license type. Prohibits most uses, sharing, and any changes.
Copyrighted materials, available under Fair Use and the TEACH Act for US-based educators, or other custom arrangements. Go to the resource provider to see their individual restrictions.