-AAA Math features a comprehensive set of thousands of interactive arithmetic lessons. …
-AAA Math features a comprehensive set of thousands of interactive arithmetic lessons.
-There is no cost or registration required to practice your math on the AAAMath.com web site.
-Unlimited practice is available on each topic which allows thorough mastery of the concepts.
-A wide range of lessons (Kindergarten through Eighth grade level) enables learning or review to occur at each individual's current level.
-Immediate feedback prevents practicing and learning incorrect methods, which is a common result of traditional homework and worksheets. Practice can continue as long as desired in a non-threatening format which helps build self-esteem and confidence.
-Please feel free to try the lessons by clicking on one of the grades at the top or a topic area on the left side of the page.
-Remember to add the site to your Favorite Places and please tell others about the site. It is an excellent way to learn or review math.
Today we're going to continue our discussion of statistical models by showing …
Today we're going to continue our discussion of statistical models by showing how we can find if there are differences between multiple groups using a collection of models called ANOVA. ANOVA, which stands for Analysis of Variance is similar to regression (which we discussed in episode 32), but allows us to compare three or more groups for statistical significance.
Do you think a red minivan would be more expensive than a …
Do you think a red minivan would be more expensive than a beige one? Now what if the car was something sportier like a corvette? Last week we introduced the ANOVA model which allows us to compare measurements of more than two groups, and today we’re going to show you how it can be applied to look at data that belong to multiple groups that overlap and interact. Most things after all can be grouped in many different ways - like a car has a make, model, and color - so if we wanted to try to predict the price of a car, it’d be especially helpful to know how those different variables interact with one another.
This downloadable text features over 200 math problems that very closely follow …
This downloadable text features over 200 math problems that very closely follow the standard curriculum for high school Algebra 2 courses, but with a strong emphasis on space science and astronomy. Fourteen chapters featuring on-grade-level Algebra 2 concepts and skill areas including statistics, probability, conics, trigonometry, complex numbers and matrix algebra. Science topics are drawn from all areas of planetary, solar and astrophysics, in addition to space exploration and rocketry.
Students build a formal understanding of probability, considering complex events such as …
Students build a formal understanding of probability, considering complex events such as unions, intersections, and complements as well as the concept of independence and conditional probability. The idea of using a smooth curve to model a data distribution is introduced along with using tables and technology to find areas under a normal curve. Students make inferences and justify conclusions from sample surveys, experiments, and observational studies. Data is used from random samples to estimate a population mean or proportion. Students calculate margin of error and interpret it in context. Given data from a statistical experiment, students use simulation to create a randomization distribution and use it to determine if there is a significant difference between two treatments.
Find the rest of the EngageNY Mathematics resources at https://archive.org/details/engageny-mathematics.
(Nota: Esta es una traducción de un recurso educativo abierto creado por …
(Nota: Esta es una traducción de un recurso educativo abierto creado por el Departamento de Educación del Estado de Nueva York (NYSED) como parte del proyecto "EngageNY" en 2013. Aunque el recurso real fue traducido por personas, la siguiente descripción se tradujo del inglés original usando Google Translate para ayudar a los usuarios potenciales a decidir si se adapta a sus necesidades y puede contener errores gramaticales o lingüísticos. La descripción original en inglés también se proporciona a continuación.)
Los estudiantes crean una comprensión formal de la probabilidad, considerando eventos complejos como sindicatos, intersecciones y complementos, así como el concepto de independencia y probabilidad condicional. La idea de usar una curva suave para modelar una distribución de datos se introduce junto con el uso de tablas y tecnología para encontrar áreas bajo una curva normal. Los estudiantes hacen inferencias y justifican conclusiones de encuestas de muestra, experimentos y estudios de observación. Los datos se usan de muestras aleatorias para estimar una media o proporción de población. Los estudiantes calculan el margen de error y lo interpretan en contexto. Dados los datos de un experimento estadístico, los estudiantes usan la simulación para crear una distribución de aleatorización y lo usan para determinar si hay una diferencia significativa entre dos tratamientos.
Encuentre el resto de los recursos matemáticos de Engageny en https://archive.org/details/engageny-mathematics.
English Description: Students build a formal understanding of probability, considering complex events such as unions, intersections, and complements as well as the concept of independence and conditional probability. The idea of using a smooth curve to model a data distribution is introduced along with using tables and technology to find areas under a normal curve. Students make inferences and justify conclusions from sample surveys, experiments, and observational studies. Data is used from random samples to estimate a population mean or proportion. Students calculate margin of error and interpret it in context. Given data from a statistical experiment, students use simulation to create a randomization distribution and use it to determine if there is a significant difference between two treatments.
Find the rest of the EngageNY Mathematics resources at https://archive.org/details/engageny-mathematics.
Developed for fifth grade and above. Primary biological content area covered:; Plant …
Developed for fifth grade and above. Primary biological content area covered:; Plant growth; Seedling morphology; Hypothesis testing; Experimental design; Line graphing; Introductory statistics.Biology In Elementary Schools is a Saint Michael's College student project. The teaching ideas on this page have been found, refined, and developed by students in a college-level course on the teaching of biology at the elementary level. Unless otherwise noted, the lesson plans have been tried at least once by students from our partner schools. This wiki has been established to share ideas about teaching biology in elementary schools. The motivation behind the creation of this page is twofold: 1. to provide an outlet for the teaching ideas of a group of college educators participating in a workshop-style course; 2. to provide a space where anyone else interested in this topic can place their ideas.
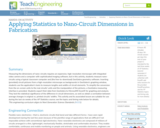
Measuring the dimensions of nano-circuits requires an expensive, high-resolution microscope with integrated …
Measuring the dimensions of nano-circuits requires an expensive, high-resolution microscope with integrated video camera and a computer with sophisticated imaging software, but in this activity, students measure nano-circuits using a typical classroom computer and (the free-to-download) GeoGebra geometry software. Inserting (provided) circuit pictures from a high-resolution microscope as backgrounds in GeoGebra's graphing window, students use the application's tools to measure lengths and widths of circuit elements. To simplify the conversion from the on-screen units to the real circuits' units and the manipulation of the pictures, a GeoGebra measuring interface is provided. Students export their data from GeoGebra to Microsoft® Excel® for graphing and analysis. They test the statistical significance of the difference in circuit dimensions, as well as obtain a correlation between average changes in original vs. printed circuits' widths. This activity and its associated lesson are suitable for use during the last six weeks of the AP Statistics course; see the topics and timing note below for details.
Developed for third and fourth grade. Students will understand how their lungs …
Developed for third and fourth grade. Students will understand how their lungs work. They will understand what lung capacity is and be able to measure their own. They will test for a relationship between their lung capacity and their height.Biology In Elementary Schools is a Saint Michael's College student project. The teaching ideas on this page have been found, refined, and developed by students in a college-level course on the teaching of biology at the elementary level. Unless otherwise noted, the lesson plans have been tried at least once by students from our partner schools. This wiki has been established to share ideas about teaching biology in elementary schools. The motivation behind the creation of this page is twofold: 1. to provide an outlet for the teaching ideas of a group of college educators participating in a workshop-style course; 2. to provide a space where anyone else interested in this topic can place their ideas.
Today we're going to finish up our discussion of Bayesian inference by …
Today we're going to finish up our discussion of Bayesian inference by showing you how we can it be used for continuous data sets and be applied both in science and everyday life. From A/B testing of websites and getting a better understanding of psychological disorders to helping with language translation and purchase recommendations Bayes statistics really are being used everywhere!
David McCandless turns complex data sets (like worldwide military spending, media buzz, …
David McCandless turns complex data sets (like worldwide military spending, media buzz, Facebook status updates) into beautiful, simple diagrams that tease out unseen patterns and connections. Good design, he suggests, is the best way to navigate information glut -- and it may just change the way we see the world. A quiz, thought provoking question, and links for further study are provided to create a lesson around the 18-minute video. Educators may use the platform to easily "Flip" or create their own lesson for use with their students of any age or level.
There is a lot of excitement around the field of Big Data, …
There is a lot of excitement around the field of Big Data, but today we want to take a moment to look at some of the problems it creates. From questions of bias and transparency to privacy and security concerns, there is still a lot to be done to manage these problems as Big Data plays a bigger role in our lives.
Today we're going to discuss the Binomial Distribution and a special case …
Today we're going to discuss the Binomial Distribution and a special case of this distribution known as a Bernoulli Distribution. The formulas that define these distributions provide us with shortcuts for calculating the probabilities of all kinds of events that happen in everyday life.They can can also be used to help us look at how probabilities are connected! For instance, knowing the chance of getting a flat tire today is useful, but knowing the likelihood of getting one this year, or in the next five years, may be more useful. And heads up, this episode is going to have a lot more equations than normal, but to sweeten the deal, we added zombies!
CK-12 Foundation gives access to high quality educational materials for K-12 students …
CK-12 Foundation gives access to high quality educational materials for K-12 students all over the world. They have high-quality, standards-aligned, open content in the STEM subjects.
This is an OUTSTANDING resource. Be sure to check out the Math & Science FlexLets
Students - select "switch to student version" from the top menu.
Today we're going to start our two-part unit on data visualization. Up …
Today we're going to start our two-part unit on data visualization. Up to this point we've discussed raw data - which are just numbers - but usually it's much more useful to represent this information with charts and graphs. There are two types of data we encounter, categorical and quantitative data, and they likewise require different types of visualizations. Today we'll focus on bar charts, pie charts, pictographs, and histograms and show you what they can and cannot tell us about their underlying data as well as some of the ways they can be misused to misinform.
Today we’re going to talk about confidence intervals. Confidence intervals allow us …
Today we’re going to talk about confidence intervals. Confidence intervals allow us to quantify our uncertainty, by allowing us to define a range of values for our predictions and assigning a likelihood that something falls within that range. And confidence intervals come up a lot like when you get delivery windows for packages, during elections when pollsters cite margin of errors, and we use them instinctively in everyday decisions. But confidence intervals also demonstrate the tradeoff of accuracy for precision - the greater our confidence, usually the less useful our range.
We may be living IN a simulation (according to Elon Musk and …
We may be living IN a simulation (according to Elon Musk and many others), but that doesn't mean we don't need to perform simulations ourselves. Today, we're going to talk about good experimental design and how we can create controlled experiments to minimize bias when collecting data. We'll also talk about single and double blind studies, randomized block design, and how placebos work.
Today we’re going to talk about data relationships and what we can …
Today we’re going to talk about data relationships and what we can learn from them. We’ll focus on correlation, which is a measure of how two variables move together, and we’ll also introduce some useful statistical terms you’ve probably heard of like regression coefficient, correlation coefficient (r), and r^2. But first, we’ll need to introduce a useful way to represent bivariate continuous data - the scatter plot. The scatter plot has been called “the most useful invention in the history of statistical graphics” but that doesn’t necessarily mean it can tell us everything. Just because two data sets move together doesn’t necessarily mean one CAUSES the other. This gives us one of the most important tenets of statistics: correlation does not imply causation.
Welcome to Crash Course Statistics! In this series we're going to take …
Welcome to Crash Course Statistics! In this series we're going to take a closer look at how statistics play a significant role in our everyday lives. Now this a "math" course, and there will definitely be some math, but we're going to focus on how statistics is useful and valuable to you - someone that performs AND consumes statistics all the time. Statistics are everywhere from batting averages and insurance rates to weather forecasting and smart assistants, and it's our hope that when you finish this series you'll get a better idea of the role statistics play in helping us better understand the world!
No restrictions on your remixing, redistributing, or making derivative works. Give credit to the author, as required.
Your remixing, redistributing, or making derivatives works comes with some restrictions, including how it is shared.
Your redistributing comes with some restrictions. Do not remix or make derivative works.
Most restrictive license type. Prohibits most uses, sharing, and any changes.
Copyrighted materials, available under Fair Use and the TEACH Act for US-based educators, or other custom arrangements. Go to the resource provider to see their individual restrictions.