Updating search results...

Search Resources

71 Results

View
Selected filters:
  • data
CS Fundamentals 3.17: Picturing Data
Conditional Remix & Share Permitted
CC BY-NC-SA
Rating
0.0 stars

Data can be used to help students understand their world and answer interesting questions. In this lesson, students will collect data from a Play Lab project and visualize it using different kinds of graphs.

Subject:
Coding
Computer & Digital Technologies
Computer Science
Education
Educational Technology
Math
Science
Material Type:
Activity/Lab
Lesson
Provider:
Code.org
Provider Set:
CS Fundamentals 2019-2111
Date Added:
10/11/2019
CS Fundamentals 6.10: Simulating Experiments
Conditional Remix & Share Permitted
CC BY-NC-SA
Rating
0.0 stars

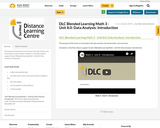
By running a simple simulation in Sprite Lab, students will experience how computing can be used to collect data that identify trends or patterns. After running the simulation multiple times, students will have an opportunity to make a prediction about how changing a variable in the simulation might impact the outcome, and then test that hypothesis.

Subject:
Coding
Computer & Digital Technologies
Computer Science
Education
Educational Technology
Math
Science
Material Type:
Activity/Lab
Lesson
Provider:
Code.org
Provider Set:
CS Fundamentals 2019-2158
Date Added:
10/11/2019
Canada Learning Code - CO2 Trends with Python
Rating
0.0 stars

"Learners use Python and the Pygal graphing library to visualize data about one of the most important issues facing our country: greenhouse gas emissions and their relation to climate change."

Subject:
Coding
Computer & Digital Technologies
Math
Science
Material Type:
Activity/Lab
Provider:
Canada Learning Code
Author:
Paul Prescod
Date Added:
12/02/2019
The Challenge Question
Read the Fine Print
Educational Use
Rating
0.0 stars

Students are introduced to the "Walk the Line" challenge question. They write journal responses to the question and brainstorm what information they need to answer the question. Ideas are shared with the class (or in pairs and then to the class, if class size is large). Then students read an interview with an engineer to gain a professional perspective on linear data sets and best-fit lines. Students brainstorm for additional ideas and add them to the list. With the teacher's guidance, students organize the ideas into logical categories of needed knowledge.
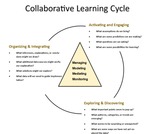
Subject:
Math
Material Type:
Lesson
Provider:
TeachEngineering
Provider Set:
TeachEngineering
Author:
Aubrey Mckelvey
Date Added:
09/18/2014
College/University 101 -Study Hall - age 15+
Rating
0.0 stars

"Welcome to Study Hall, where study sessions come to life. Whether your teen is a student in need of course support or is looking to explore new topics, this series will light the way. Study Hall makes learning enjoyable and effective, breaking down complex subjects into digestible, enjoyable content."

"How to College/University"
*Learn about pretty much anything here; even take college level courses!

Subject:
Career & Work Exploration
Education
History
Life Transition
Math
Practical & Applied Arts
Social Studies
Material Type:
Activity/Lab
Author:
Arizona State University
crash course
Study Hall
Date Added:
10/16/2023
Crash Science in the Classroom
Rating
0.0 stars

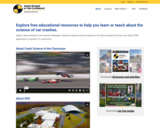
"Sponsored by the the Insurance Institute for Highway Safety, this resource provides free educational resources to help you learn or teach about the science of car crashes. Videos, demonstrations and teacher-developed, classroom-tested activities aligned to the latest standards bring crash safety STEM applications to grade 5-12 classrooms." MIT

Start by watching the "about" video. Follow "How it Works"

You can select Lessons on the top menu or more videos.

VIEW, DO, EXPLORE, UTILIZE

Subject:
Physical Science
Physics
Science
Material Type:
Activity/Lab
Lesson
Author:
IHS-HLDI
Date Added:
04/30/2024
DLC Blended Learning Math 3 - Unit 8.0: Data Analysis: Introduction
Conditional Remix & Share Permitted
CC BY-NC-SA
Rating
0.0 stars

The purpose of this lesson is to introduce the data analysis unit and provide a unit overview.

Included is a YouTube video to support Grade 3 Blended Learning Math - Unit 8.0: Data Analysis: Introduction.

Subject:
Math
Material Type:
Activity/Lab
Homework/Assignment
Lesson
Provider:
Sun West Distance Learning Centre (DLC)
Date Added:
04/08/2019
DLC Blended Learning Math 3 - Unit 8.1: Data Analysis: Collecting and Organizing Data
Conditional Remix & Share Permitted
CC BY-NC-SA
Rating
0.0 stars

The purpose of this lesson is for the students to collect and organize data.

Included is a YouTube video to support Grade 3 Blended Learning Math - Unit 8.1: Data Analysis: Collecting and Organizing Data.

Subject:
Math
Material Type:
Activity/Lab
Homework/Assignment
Lesson
Provider:
Sun West Distance Learning Centre (DLC)
Date Added:
04/08/2019
DLC Blended Learning Math 3 - Unit 8.2: Data Analysis: Line Plots
Conditional Remix & Share Permitted
CC BY-NC-SA
Rating
0.0 stars

The purpose of this lesson is to interpret and draw line plots.

Included is a YouTube video to support Grade 3 Blended Learning Math - Unit 8.2: Data Analysis: Line Plots.

Subject:
Math
Material Type:
Activity/Lab
Homework/Assignment
Lesson
Provider:
Sun West Distance Learning Centre (DLC)
Date Added:
04/08/2019
DLC Blended Learning Math 3 - Unit 8.3: Data Analysis: Reading Bar Graphs
Conditional Remix & Share Permitted
CC BY-NC-SA
Rating
0.0 stars

The purpose of this lesson is to read and interpret bar graphs.

Included is a YouTube video to support Grade 3 Blended Learning Math - Unit 8.3: Data Analysis: Reading Bar Graphs.

Subject:
Math
Material Type:
Activity/Lab
Homework/Assignment
Lesson
Provider:
Sun West Distance Learning Centre (DLC)
Date Added:
04/08/2019
DLC Blended Learning Math 3 - Unit 8.5: Data Analysis: Using Graphs to Solve Problems
Conditional Remix & Share Permitted
CC BY-NC-SA
Rating
0.0 stars

The purpose of this lesson is to use bar graphs to solve problems.

Included is a YouTube video to support Grade 3 Blended Learning Math - Unit 8.5: Data Analysis: Using Graphs to Solve Problems.

Subject:
Math
Material Type:
Activity/Lab
Assessment
Lesson
Provider:
Sun West Distance Learning Centre (DLC)
Date Added:
04/08/2019
DLC Blended Learning Math 4 - Unit 8.0: Data Analysis - Introduction
Conditional Remix & Share Permitted
CC BY-NC-SA
Rating
0.0 stars

The purpose of this lesson is to activate prior knowledge about interpreting data from charts and graphs.

Included is a YouTube video to support Grade 4 Blended Learning Math - Unit 8.0: Data Analysis - Introduction.

Subject:
Math
Material Type:
Activity/Lab
Homework/Assignment
Lesson
Provider:
Sun West Distance Learning Centre (DLC)
Date Added:
04/25/2019
DLC Blended Learning Math 5 - Unit 7.1: Statistics and Probability - First-Hand Data and Second-Hand Data
Conditional Remix & Share Permitted
CC BY-NC-SA
Rating
0.0 stars

The purpose of this lesson is to explore first-hand and second-hand data.

Included is a YouTube video to support Grade 5 Blended Learning Math - Unit 7.1: Statistics and Probability - First-Hand Data and Second-Hand Data.

Subject:
Math
Material Type:
Activity/Lab
Homework/Assignment
Lesson
Provider:
Sun West Distance Learning Centre (DLC)
Date Added:
05/10/2019
DLC Blended Learning Math 5 - Unit 7.2: Statistics and Probability - Interpreting Double Bar Graphs
Conditional Remix & Share Permitted
CC BY-NC-SA
Rating
0.0 stars

The purpose of this lesson is to explore interpreting double bar graphs.

Included is a YouTube video to support Grade 5 Blended Learning Math - Unit 7.2: Statistics and Probability - Interpreting Double Bar Graphs.

Subject:
Math
Material Type:
Activity/Lab
Homework/Assignment
Lesson
Provider:
Sun West Distance Learning Centre (DLC)
Date Added:
05/10/2019
DLC Blended Learning Math 5 - Unit 7.3: Statistics and Probability - Constructing Double Bar Graphs
Conditional Remix & Share Permitted
CC BY-NC-SA
Rating
0.0 stars

The purpose of this lesson is to explore how to construct a double bar graph.

Included is a YouTube video to support Grade 5 Blended Learning Math - Unit 7.3: Statistics and Probability - Constructing Double Bar Graphs.

Subject:
Math
Material Type:
Activity/Lab
Homework/Assignment
Lesson
Provider:
Sun West Distance Learning Centre (DLC)
Date Added:
05/10/2019
DLC Blended Learning Math 6 - Unit 7.5: Data Analysis and Probability - Choosing an Appropriate Graph
Conditional Remix & Share Permitted
CC BY-NC-SA
Rating
0.0 stars

The purpose of this lesson is to explore choosing an appropriate graph.

Included is a YouTube video to support Grade 6 Blended Learning Math - Unit 7.5: Data Analysis and Probability - Choosing an Appropriate Graph.

Subject:
Math
Material Type:
Activity/Lab
Homework/Assignment
Lesson
Provider:
Sun West Distance Learning Centre (DLC)
Date Added:
05/17/2019
DLC Blended Learning Math 8 - Unit 7.1: Data Analysis and Probability - Choosing An Appropriate Graph
Conditional Remix & Share Permitted
CC BY-NC-SA
Rating
0.0 stars

The purpose of this lesson is to identify the advantages and disadvantages involved with representing data using various types of graphs.

Included is a YouTube video to support Grade 8 Blended Learning Math - Unit 7.1: Data Analysis and Probability - Choosing An Appropriate Graph.

Subject:
Math
Material Type:
Activity/Lab
Homework/Assignment
Lesson
Provider:
Sun West Distance Learning Centre (DLC)
Date Added:
06/17/2019