This 10-minute video lesson covers more intuition of what a derivative is. …
This 10-minute video lesson covers more intuition of what a derivative is. It looks at using the derivative to find the slope at any point along f(x)=x^2.
This lab demonstrates Hooke's Law with the use of springs and masses. …
This lab demonstrates Hooke's Law with the use of springs and masses. Students attempt to determine the proportionality constant, or k-value, for a spring. They do this by calculating the change in length of the spring as different masses are added to it. The concept of a spring's elastic limit is also introduced, and the students test to makes sure the spring's elastic limit has not been reached during their lab tests. After compiling their data, they attempt to find an average value of the spring's k-value by measuring the slopes between each of their data points. Then they apply what they've learned about springs to how engineers might use that knowledge in the design of a toy that enables kids to jump 2-3 feet in the air.
The learning of linear functions is pervasive in most algebra classrooms. Linear …
The learning of linear functions is pervasive in most algebra classrooms. Linear functions are vital in laying the foundation for understanding the concept of modeling. This unit gives students the opportunity to make use of linear models in order to make predictions based on real-world data, and see how engineers address incredible and important design challenges through the use of linear modeling. Student groups act as engineering teams by conducting experiments to collect data and model the relationship between the wall thickness of the latex tubes and their corresponding strength under pressure (to the point of explosion). Students learn to graph variables with linear relationships and use collected data from their designed experiment to make important decisions regarding the feasibility of hydraulic systems in hybrid vehicles and the necessary tube size to make it viable.
Students explore building a pyramid, learning about the simple machine called an …
Students explore building a pyramid, learning about the simple machine called an inclined plane. They also learn about another simple machine, the screw, and how it is used as a lifting or fastening device. During a hands-on activity, students see how the angle of inclination and pull force can make it easier (or harder) to pull an object up an inclined plane.
Prepared with pre-algebra or algebra 1 classes in mind, this module leads …
Prepared with pre-algebra or algebra 1 classes in mind, this module leads students through the process of graphing data and finding a line of best fit while exploring the characteristics of linear equations in algebraic and graphic formats. Then, these topics are connected to real-world experiences in which people use linear functions. During the module, students use these scientific concepts to solve the following hypothetical challenge: You are a new researcher in a lab, and your boss has just given you your first task to analyze a set of data. It being your first assignment, you ask an undergraduate student working in your lab to help you figure it out. She responds that you must determine what the data represents and then find an equation that models the data. You believe that you will be able to determine what the data represents on your own, but you ask for further help modeling the data. In response, she says she is not completely sure how to do it, but gives a list of equations that may fit the data. This module is built around the legacy cycle, a format that incorporates educational research feindings on how people best learn.
Students explore the concept of similar right triangles and how they apply …
Students explore the concept of similar right triangles and how they apply to trigonometric ratios. Use this lesson as a refresher of what trig ratios are and how they work. In addition to trigonometry, students explore a clinometer app on an Android® or iOS® device and how it can be used to test the mathematics underpinning trigonometry. This prepares student for the associated activity, during which groups each put a clinometer through its paces to better understand trigonometry.
An interactive applet and associated web page that demonstrate the equation of …
An interactive applet and associated web page that demonstrate the equation of a line in coordinate geometry. The equation is in the form y=mx+b. The user can move two sliders that control a and b. The graph changes accordingly and equation for the line is continuously recalculated with every slider move. The grid, axis pointers and coordinates can be turned on and off. The equation display can be turned off to permit class exercises and then turned back on the verify the answers. The applet can be printed as it appears on the screen to make handouts. The web page has a full description of the concept of the equation of a line, a worked example and has links to other pages relating to coordinate geometry. Applet can be enlarged to full screen size for use with a classroom projector. This resource is a component of the Math Open Reference Interactive Geometry textbook project at http://www.mathopenref.com.
"The Core Knowledge Foundation provides open access to content-rich curriculum materials for …
"The Core Knowledge Foundation provides open access to content-rich curriculum materials for preschool through grade 8, including the Core Knowledge Curriculum Series™, with many materials now available and many more in development."
You will need to provide your email address to download these amazing resources. CK has aligned their ELA to the Science of Reading in collaboration with Amplify Reading. *Full Units *Books for Students *Teaching Materials *Scope & Sequence
Students learn how to quickly and efficiently interpret graphs, which are used …
Students learn how to quickly and efficiently interpret graphs, which are used for everyday purposes as well as engineering analysis. Through a practice handout completed as a class and a worksheet completed in small groups, students gain familiarity in talking about and interpreting graphs. They use common graph terminology such as independent variable, dependent variable, linear data, linear relationship and rate of change. The equation for calculating slope is explained. The focus is on students becoming able to clearly describe linear relationships by using the language of slope and the rate of change between variables. At lesson end, students discuss the relationship between variables as presented by the visual representation of a graph. Then they independently complete a homework handout.
Students investigate the relationships between angles and side lengths in right triangles …
Students investigate the relationships between angles and side lengths in right triangles with the help of materials found in the classroom and a mobile device. Using all or part of a meter stick or dowel and text books or other supplies, students build right triangles and measure the angles using a clinometer application on an Android® (phone or tablet) or iOS® device (iPhone® or iPad®). Then they are challenged to create a triangle with a given side length and one angle. The electronic device is used to measure the accuracy of their constructions.
Students learn how volume, viscosity and slope are factors that affect the …
Students learn how volume, viscosity and slope are factors that affect the surface area that lava covers. Using clear transparency grids and liquid soap, students conduct experiments, make measurements and collect data. They also brainstorm possible solutions to lava flow problems as if they were geochemical engineers, and come to understand how the properties of lava are applicable to other liquids.
Students learn about an important characteristic of lines: their slopes. Slope can …
Students learn about an important characteristic of lines: their slopes. Slope can be determined either in graphical or algebraic form. Slope can also be described as positive, negative, zero or undefined. Students get an explanation of when and how these different types of slope occur. Finally, they learn how slope relates to parallel and perpendicular lines. When two lines are parallel, they have the same slope and when they are perpendicular their slopes are negative reciprocals of one another.
Students use inclined planes as they recreate the difficult task of raising …
Students use inclined planes as they recreate the difficult task of raising a monolith of rock to build a pyramid. They compare the push and pull of different-sized blocks up an inclined plane, determine the angle of inclination, and learn the changes that happen when the angle is increased or decreased.
Students are introduced to the health risks caused by cooking and heating …
Students are introduced to the health risks caused by cooking and heating with inefficient cook stoves inside homes, a common practice in rural developing communities. Students simulate the cook stove scenario and use the engineering design process, including iterative trials, to increase warmth inside a building while reducing air quality problems. Students then collect and graph data, and analyze their findings.
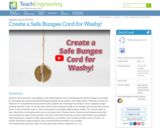
Students learn about the role engineers and mathematicians play in developing the …
Students learn about the role engineers and mathematicians play in developing the perfect bungee cord length by simulating and experimenting with bungee jumping using washers and rubber bands. Working as if they are engineers for a (hypothetical) amusement park, students are challenged to develop a show-stopping bungee jumping ride that is safe. To do this, they must find the maximum length of the bungee cord that permits jumpers (such as brave Washy!) to get as close to the ground as possible without going "splat"! This requires them to learn about force and displacement and run an experiment. Student teams collect and plot displacement data and calculate the slope, linear equation of the line of best fit and spring constant using Hooke's law. Students make hypotheses, interpret scatter plots looking for correlations, and consider possible sources of error. An activity worksheet, pre/post quizzes and a PowerPoint® presentation are included.
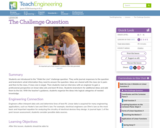
Students are introduced to the "Walk the Line" challenge question. They write …
Students are introduced to the "Walk the Line" challenge question. They write journal responses to the question and brainstorm what information they need to answer the question. Ideas are shared with the class (or in pairs and then to the class, if class size is large). Then students read an interview with an engineer to gain a professional perspective on linear data sets and best-fit lines. Students brainstorm for additional ideas and add them to the list. With the teacher's guidance, students organize the ideas into logical categories of needed knowledge.
Math Antics has amazing videos to explain concepts for Math. The videos …
Math Antics has amazing videos to explain concepts for Math. The videos are very clear and explicit and students love them. All of the video lessons are FREE.
There are also follow up exercises, videos and worksheets that students can use to solidify learning - but you will be required to pay $20 a year to access these. hat being said, it's super useful even without a paid account!
The videos are organized by strand, and all are free.
No restrictions on your remixing, redistributing, or making derivative works. Give credit to the author, as required.
Your remixing, redistributing, or making derivatives works comes with some restrictions, including how it is shared.
Your redistributing comes with some restrictions. Do not remix or make derivative works.
Most restrictive license type. Prohibits most uses, sharing, and any changes.
Copyrighted materials, available under Fair Use and the TEACH Act for US-based educators, or other custom arrangements. Go to the resource provider to see their individual restrictions.