
Free collection of TONS of graphic organizers.
- Subject:
- Education
- English Language Arts
- Science
- Social Studies
- Material Type:
- Activity/Lab
- Teaching/Learning Strategy
- Author:
- Kassidy M
- Date Added:
- 06/06/2019
Free collection of TONS of graphic organizers.

Today, we're going to discuss the critical role graphical user interfaces, or GUIs played in the adoption of computers. Before the mid 1980's the most common way people could interact with their devices was through command line interfaces, which though efficient, aren't really designed for casual users. This all changed with the introduction of the Macintosh by Apple in 1984. It was the first mainstream computer to use a GUI, standing on the shoulder of nearly two decades of innovation including work from the father of the GUI himself, Douglas Englebart, and some amazing breakthroughs at Xerox Parc.
The students will be able to identify questions and concepts in the ability to construct accurate graphs, recognize and analyze alternative explanations and models by the end of this activity.
This is an activity about the relation between day length and temperature. In one team, learners will create and analyze a graph of hours of sunlight versus month of the year for a number of latitudes. In another team, learners will graph temperature versus month for the same latitudes. The teams then compare data and draw conclusions from their analyses.
This is a lesson about visual spectra. Learners will explore different ways of displaying visual spectra, including colored "barcode" spectra, like those produced by a diffraction grating, and line plots displaying intensity versus color, or wavelength. Students learn that a diffraction grating acts like a prism, bending light into its component colors. The activity is part of Project Spectra, a science and engineering program for middle-high school students, focusing on how light is used to explore the Solar System.
Students are introduced to different ways of displaying visual spectra, including colored "barcode" spectra, like those produced by a diffraction grating, and line plots displaying intensity versus color, or wavelength. Students learn that a diffraction grating acts like a prism, bending light into its component colors.
Students simulate disease transmission by collecting data based on their proximity to other students. One option for measuring proximity is by having Bluetooth devices "discover" each other. After data is collected, students apply graph theory to analyze it, and summarize their data and findings in lab report format. Students learn real-world engineering applications of graph theory and see how numerous instances of real-world relationships can be more thoroughly understood by applying graph theory. Also, by applying graph theory the students are able to come up with possible solutions to limit the spread of disease. The activity is intended to be part of a computer science curriculum and knowledge of the Java programming language is required. To complete the activity, a computer with Java installed and appropriate editing software is needed.
Students will learn about NASA's Radiation Belt Storm Probes (RBSP), Earth's van Allen Radiation Belts, and space weather through reading a NASA press release and viewing a NASA eClips video segment. Then students will use simple linear functions to examine the scale of the radiation belts and the strength of Earth's magnetic field. This activity is part of the Space Math multimedia modules that integrate NASA press releases, NASA archival video, and mathematics problems targeted at specific math standards commonly encountered in middle school textbooks. The modules cover specific math topics at multiple levels of difficulty with real-world data and use the 5E instructional sequence.
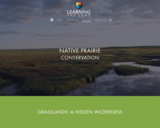
A webpage describing the grasslands ecosystem in Saskatchewan. Includes a map, descriptions, video, and interactive quizzes.
This resource can also be used for ELA CC4.4- I can write to make a descriptive narrative and expository piece. Students can use this page as a source during a research assignment.
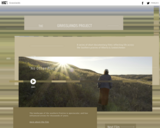
In the summer of 2015, filmmaker Scott Parker travelled to the great plains of southern Saskatchewan to produce 10 short documentary films based on community-generated ideas. Subjects, themes, even interview questions were all selected using significant community input, and each film was screened with the participants for their feedback and final approval.
Students learn about water poverty and how water engineers can develop appropriate solutions to a problem that is plaguing nearly a sixth of the world's population. Students follow the engineering design process to design a gravity-fed water system. They choose between different system parameters such as pipe sizes, elevation differentials between entry and exit pipes, pipe lengths and tube locations to find a design that provides the maximum flow and minimum water turbidity (cloudiness) at the point of use. In this activity, students play the role of water engineers by designing and building model gravity-fed water systems, learning the key elements necessary for viable projects that help improve the lives people in developing communities.
Visualize the gravitational force that two objects exert on each other. Change properties of the objects in order to see how it changes the gravity force.
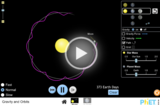
Move the Sun, Earth, Moon and space station to see how it affects their gravitational forces and orbital paths. Visualize the sizes and distances between different heavenly bodies, and turn off gravity to see what would happen without it!
Move the sun, earth, moon and space station to see how it affects their gravitational forces and orbital paths. Visualize the sizes and distances between different heavenly bodies, and turn off gravity to see what would happen without it!
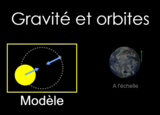
Une série de simulations provenant de l’Université de Colorado à Boulder pour les 9e – 12e au sujet des sciences.
« Déplacez le soleil, la Terre, la lune et la station spatiale pour observer comment cela affecte leurs forces gravitationnelles et leurs trajectoires orbitales. Visualisez les tailles et les distances entre différents corps célestes, et désactivez la gravité pour voir ce qui se passerait sans elle ! »
In a multi-week experiment, student groups gather data from the photobioreactors that they build to investigate growth conditions that make algae thrive best. Using plastic soda bottles, pond water and fish tank aerators, they vary the amount of carbon dioxide (or nutrients or sunlight, as an extension) available to the microalgae. They compare growth in aerated vs. non-aerated conditions. They measure growth by comparing the color of their algae cultures in the bottles to a color indicator scale. Then they graph and analyze the collected data to see which had the fastest growth. Students learn how plants biorecycle carbon dioxide into organic carbon (part of the carbon cycle) and how engineers apply their understanding of this process to maximize biofuel production.
Water travels... a lot. In fact, the water cycle is amazing and takes water all over the planet by using evaporation, condensation, and precipitation. In this episode of Crash Course Kids, Sabrina shows us how the water cycle works and how you can create a mini water cycle right in your own kitchen!
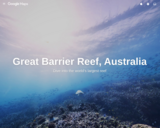
This collection of images was part of the first group of 360 images added to Google Maps. You can explore more 360 views through the Google Maps Street View collection.
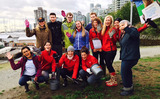
Learn more about the Great Canadian Shoreline Cleanup, including information on the sources and impacts of shoreline litter and what our national network of volunteers are doing to make a positive difference! Explore interactive maps that contain data from cleanups across Canada in 2017 and discover the most common items found on shorelines. We also provide ideas for how you can get involved by reducing your use and leading a shoreline cleanup in your community!
In this activity, students will use cookies to simulate the distribution of our nonrenewable resources (energy). Then, they will discuss how the world's growing population affects the fairness and effectiveness of this distribution of these resources and how engineers work to develop technologies to support the population.