The Early Learning Portal provides current information on these initiatives, easy access …
The Early Learning Portal provides current information on these initiatives, easy access to early years documents, resources and learning opportunities created to support those working with young children and their families in Saskatchewan. We encourage educators working with children in the early years to access the portal for information.
In the growing season, farmers and ranchers keep a watchful eye for …
In the growing season, farmers and ranchers keep a watchful eye for any sign of drought. Early warning information can increase their range of options for dealing with the lack of water.
As stated on the website, "The Early Years Evaluation – Teacher Assessment …
As stated on the website, "The Early Years Evaluation – Teacher Assessment (EYE-TA) measures a variety of items and provides a holistic picture for school leaders." This link will provide an overview and explanation of each component of the assessment as well as the research behind it.
Seesaw is a valuable learning and communication tool to bring the classroom …
Seesaw is a valuable learning and communication tool to bring the classroom experience into the homes of your students and engage parents as partners in their child’s education. Documentation of learning, through Seesaw, will have an incredible impact on engagement as it showcases evidence and growth of learning in a timely and family-friendly manner. The continuum guide is intended to provide educators with concrete formative assessment examples of the types, and depth, of information that educators can track and share with families. Adapted and developed with permission from Prairie Valley School Division No. 208 and Saskatchewan Rivers Public School Division No.119
The official Earth Day website showcases a variety of information surrounding this …
The official Earth Day website showcases a variety of information surrounding this impactful day. The information includes Projects, Challenges, Videos to provide background information about the our world today and challenges and projects that your classrooms can participate in to make a difference in our world now and for the future. In addition, the website has downloadable ToolKits for your classrooms.
This is an activity about planetary sizes and distances. Learners will construct …
This is an activity about planetary sizes and distances. Learners will construct a scale model of the Earth, Earth‰Ûªs Moon and Mars in relation to each other using balloons. They will use this model to predict distances and reflect on how scientists use models to construct explanations through the scientific process. The lesson models scientific inquiry using the 5E instructional model and includes teacher notesand vocabulary.
In this chapter, students will explore relationships between air quality and population …
In this chapter, students will explore relationships between air quality and population density using the image visualization tool, Google Earth. You will learn how to download NO2 data and analyze them to develop a conceptual understanding of how population and topography can influence the air quality of a region. Once you have learned the techniques, you are encouraged to explore seasonal changes in nitrogen dioxide concentrations at other locations. This chapter is part of the Earth Exploration Toolbook (EET). Each EET chapter provides teachers and/or students with direct practice for using scientific tools to analyze Earth science data. Students should begin on the Case Study page.
Students will be guided through the process of locating and graphing web-based …
Students will be guided through the process of locating and graphing web-based environmental data that has been collected by GLOBE Program participants. This chapter highlights the opportunities for using GLOBE Program data to introduce basic concepts of Earth system science. It is part of the Earth Exploration Toolbook, which provides teachers and/or students with direct practice for using scientific tools to analyze Earth science data. Students should begin on the Case Study page.
This activity's storyline is built around the real-life case study of Dr. …
This activity's storyline is built around the real-life case study of Dr. Walt Meier, a Sea Ice Scientist from Boulder, Colorado. In the fictional story, the students of Churchill become concerned about wildlife in their region because polar bears have become a nuisance in the town. According to the local elders, the sea ice patterns have changed. The students turn to Dr. Meier for his expertise in sea ice analysis. Dr. Meier then instructs the students in the use of ImageJ and guides them through the research process. This chapter is part of the Earth Exploration Toolbook (EET). Each EET chapter provides teachers and/or students with direct practice for using scientific tools to analyze Earth science data. Students should begin on the Case Study page.
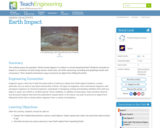
This activity poses the question: What would happen if a meteor or …
This activity poses the question: What would happen if a meteor or comet impacted Earth? Students simulate an impact in a container of sand using various-sized rocks, all while measuring, recording and graphing results and conclusions. Then students brainstorm ways to prevent an object from hitting the Earth.
This is a wallsheet that contains 11 activities relating to Mars. Learners …
This is a wallsheet that contains 11 activities relating to Mars. Learners could investigate: how far away is Mars, why does Mars have craters, water on Mars, Mars' minerals, how high the mountains are on Mars, and are invited to create a martian calendar and travel guide.
This text explores a few of the many concepts that frequently come …
This text explores a few of the many concepts that frequently come up in the study of Earth systems and global climate change. Students will be exposed to many problems involving unit conversion. Global climate change reports involve terms such as kilowatt-hour, megawatt-hour, and gigawatt-hour, as well as megatons and gigatons. Students will become versed in converting units where appropriate, and through the calculations, will work with the concept of significant figures. Creating linear equations from graphical and tabular information is covered, as well as forecasting. The text is meant to be used as a companion to standard Earth science and mathematics courses, and presents enough application problems to allow students to quantitatively understand typical media reports about global climate change.
Build a realistic model of the Earth using sunlight as a reference …
Build a realistic model of the Earth using sunlight as a reference to understand phenomena related to the position of the Earth with respect to the Sun.
No restrictions on your remixing, redistributing, or making derivative works. Give credit to the author, as required.
Your remixing, redistributing, or making derivatives works comes with some restrictions, including how it is shared.
Your redistributing comes with some restrictions. Do not remix or make derivative works.
Most restrictive license type. Prohibits most uses, sharing, and any changes.
Copyrighted materials, available under Fair Use and the TEACH Act for US-based educators, or other custom arrangements. Go to the resource provider to see their individual restrictions.