This is a pretty fun lesson that has two main parts. First …
This is a pretty fun lesson that has two main parts. First students warm up by reflecting on the reasons data visualizations are used to communicate about data. This leads to the main activity in which students look at some collections of (mostly bad) data visualizations, rate them, explain why a good one is effective, and also suggest a fix for a bad one.
In the second part of class students compare their experiences and create a class list of common faults and best practices for creating data visualizations. Finally, students review and read the first few pages of **Data Visualization 101: How to design charts and graphs** to see some basic principles of good data visualizations and see how they compare with the list the class came up with.
Now that students have had the chance to see and evaluate various …
Now that students have had the chance to see and evaluate various data visualizations, they will learn to make visualizations of their own. This lesson teaches students how to build visualizations from provided datasets. The levels in Code Studio provide a detailed walkthrough of how to use Google Sheets to create several different kinds of charts. While this lesson focuses on the Google Sheets tool, other tools may be substituted at the teacher’s discretion, and MS Excel support is coming soon to the lesson.
The main activity teaches students to build different chart types (scatter, line, and bar charts) from a single data set. It should be emphasized to students that the purpose of this lesson is to explore and experiment with creating different types of visualizations, not to build the perfect chart. Students will have a chance to create and customize their own charts. At the end of class, students compare their custom visualizations with those of their classmates.
In this lesson, students will collaboratively investigate some datasets and use visualization …
In this lesson, students will collaboratively investigate some datasets and use visualization tools to “discover a data story.” The lesson assumes that students know how to use some kind of visualization tool - in the previous lesson we used the charting tools of a basic spreadsheet program. Students should be working with a partner but without much teacher hand-holding. Most of the time should be spent with students poking around the data and trying to discover connections and trends using data visualization tools. It is up to them to discover a trend, make a chart, and accurately write about it.
In this lesson, students begin working with the data that they have …
In this lesson, students begin working with the data that they have been collecting since the first lesson of the chapter in the class "data tracker." They are introduced to the first step in analyzing data: cleaning the data. Students will follow a guide in Code Studio, which demonstrates the common techniques of filtering and sorting data to familiarize themselves with its contents. Then they will correct errors they find in the data by either hand-correcting invalid values or deleting them. Finally they will categorize any free-text columns that were collected to prepare them for analysis. This lesson introduces many new skills with spreadsheets and reveals the sometimes subjective nature of data analysis.
In this lesson students learn how create their own summary tables from …
In this lesson students learn how create their own summary tables from raw data. A summary table typically represents one or more aggregations (groupings of items) and computations that are performed on the raw dataset. In most spreadsheet programs, a summary table is called a pivot table. In the lesson, students learn how to make pivot tables in Google Sheets using a provided dataset. Then students turn to the data they’ve collected as a class and, with their partner, use pivot tables to investigate it further.
For this Practice PT students will analyze the data that they have …
For this Practice PT students will analyze the data that they have been collecting as a class in order to demonstrate their ability to discover, visualize, and present a trend or pattern they find in the data. Leading up to this lesson, students will have been working in pairs to clean and summarize their data. Students should complete this project individually but can get feedback on their ideas from their data-cleaning partner.
**Note**: This is NOT the official AP® Performance Task that will be submitted as part of the Advanced Placement exam; it is a practice activity intended to prepare students for some portions of their individual performance at a later time.
Media literacy is so important in today's society. This is CANADIAN program …
Media literacy is so important in today's society. This is CANADIAN program from CIVIX. It provides opportunities for: *Resources (including full lessons and pre/post assessments) *Example Bank *Workshops
You will need to sign up for a free account to access this excellent program.
"False and misleading information is rampant online, and people lack the skills and motivation to determine what to trust. To build the next generation of informed citizens, we need to adopt new ways to teach digital media literacy and source evaluation."
« La littératie médiatique est cruciale dans la société contemporaine. CTRL-F s'agit …
« La littératie médiatique est cruciale dans la société contemporaine. CTRL-F s'agit d'un programme CANADIEN de CIVIX. Il fournit :
-Des ressources (y compris des leçons complètes et des évaluations) -Une banque d'exemples -Des ateliers
Vous devriez vous inscrire (compte gratuit) pour accéder à ce programme excellent.
«Les informations fausses et trompeuses se multiplient sur le Web et les internautes ne disposent pas forcément des connaissances et des aptitudes nécessaires pour savoir à quoi ils peuvent se fier. Pour former la prochaine génération de citoyens informés, nous devons adopter de nouvelles méthodes d’enseignement en matière de littératie des médias numériques et d’évaluation des sources.»»
This art history video discussion examines Gustave Caillebotte's "Man at his Bath", …
This art history video discussion examines Gustave Caillebotte's "Man at his Bath", 1884, oil on canvas (Private Collection, on loan to the National Gallery, London).
This art history video discussion examines Gustave Caillebotte's "The Floor Scrapers (Les …
This art history video discussion examines Gustave Caillebotte's "The Floor Scrapers (Les raboteurs de parquet)", 1875, oil on canvas, 102 x 146.5 cm (Musee d'Orsay, Paris).
CaillouMD est une série télévisée primée mettant en vedette un garçon de …
CaillouMD est une série télévisée primée mettant en vedette un garçon de quatre ans, curieux, à l’univers rempli de plaisir, d’apprentissages et d’imagination; une source d’inspiration et d’épanouissement affectif pour des générations d’enfants d’âge préscolaire invités à explorer le monde qui les entoure.
Ce site vous offre plusieurs activités qui discutent de cette série télévisée.
This lesson helps define imagination and creativity and explain how it helps …
This lesson helps define imagination and creativity and explain how it helps us learn and about ourselves and the world. Caine created a massive cardboard arcade and is the inspiration behind this lesson.
"Brothers Mike and Matt use a combination of live action and animation …
"Brothers Mike and Matt use a combination of live action and animation to take viewers on a journey of learning and self-discovery. Join Cajun Koi Academy to supercharge study sessions, level up on self-improvement, and embrace a positive mindset." (Common Sense Media)
In Food Studies 7 and 8 students already have the basic background …
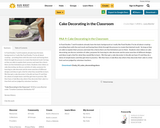
In Food Studies 7 and 8 students already have the basic background so I really like Food Studies 9 to be all about creating – providing them with the end result and having them think through the process to create that desired result. So long as they are able to explain their process and meet the criteria there are few limitations put on them. Students view videos on cake decorating, we discuss varieties of cakes, purposes for learning to cake decorate and do some searches of different designs and ideas to get a feel for what they would like to learn. We then get a cake decorator in (locally we have 2!) and they do a demo of simple basics and they get time to practice. We then have a Cake Boss day where they decorate their cake in a time limit and are judged by volunteer teachers.
This short video and interactive assessment activity is designed to teach third …
This short video and interactive assessment activity is designed to teach third graders about calculating and comparing capacities with illustrations (metric units).
No restrictions on your remixing, redistributing, or making derivative works. Give credit to the author, as required.
Your remixing, redistributing, or making derivatives works comes with some restrictions, including how it is shared.
Your redistributing comes with some restrictions. Do not remix or make derivative works.
Most restrictive license type. Prohibits most uses, sharing, and any changes.
Copyrighted materials, available under Fair Use and the TEACH Act for US-based educators, or other custom arrangements. Go to the resource provider to see their individual restrictions.