
Find safety information on baby slings, strollers, bottles and pacifiers. Also learn about infant nutrition.
- Subject:
- Health & Fitness
- Health Education
- Material Type:
- Primary Source
- Provider:
- Government of Canada
- Date Added:
- 06/06/2018

Find safety information on baby slings, strollers, bottles and pacifiers. Also learn about infant nutrition.

Graphic organizers and worksheets that help K-12 students with their inferencing skills. Inferencing is an important for understanding text as often times authors imply themes and ideas.

Students will really get into character when they read short stories and analyze the howŐs and whyŐs of charactersŐ behaviors.
Put the word inferring on the board, have they ever heard of it? Explain it is something we do
all the time, it just has a special name. – figuring out what something is when it isn’t totally
explained in the story
- Using clues to make good guesses
How do we do this? - look at the pictures, what do you see
- How do the characters act
- What do the characters say
- What other information can you get from the text
Have students practice with facial expressions – what does the audience infer? What evidence
leads them to this?
A mini unit for Grades 3 and 4 Social Studies and Language Arts
Various materials to assist in teaching inference strategies to children.
A poster to help students and teachers apply inferring as a reading strategy.

Much of statistics is based upon using data from a random sample that is representative of the population at large. From that sample mean, we can infer things about the greater population mean. We'll explain.

The ratio of a circle's circumference to its diameter is always the same: 3.14159... and on and on (literally!) forever. This irrational number, pi, has an infinite number of digits, so we'll never figure out its exact value no matter how close we seem to get. Reynaldo Lopes explains pi's vast applications to the study of music, financial models, and even the density of the universe.

Students use scaling from real-world data to obtain an idea of the immense size of Mars in relation to the Earth and the Moon, as well as the distances between them. Students calculate dimensions of the scaled versions of the planets, and then use balloons to represent their relative sizes and locations.

This resource consists of various Inflation Resources- lessons, graphics, presentations, assignments and quiz questions for teachers to use with Module 33: Macroeconomics within the Financial Literacy courses

We’ve mentioned already that there’s a lot of money in media and a huge chunk of that money is spent on trying to get you to do something – buy something, vote a certain way, change a behavior. How does advertising work? And what’s the difference between advertising, public relations, and propaganda? We’re going to talk about all that and more today.
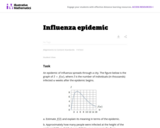
The purpose of this task is to probe students' ability to correlate symbolic statements about a function using function notation with a graph of the function, and to interpret their answers in terms of the quantities between which the function describes a relationship

Students will create an infographic to share knowledge and data about an issue or science topic they are studying.
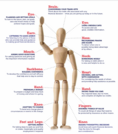
Review these news articles and infographics on the impact and connection between financial wellness and physical and mental health. Students can reflect on the impact of financial stress and how it affects everything- physical, mental health and even workplace performance. The statistics in the news arcticles on financial stress are very challenging right now for Canadians, so students could read these articles and look for ways to change these statistics going forward for their generation.
Identity is a major focus of the grade 6 curriculum both in ELA and in Arts Ed. therefore I wanted to create a project that could be incorporated into both subjects.
Project: The students were given the task to create an infographic that would represent themselves – a bio that includes their personal values and opinions. I invited Arlene Low into the class to introduce the project and explain what infographics are.

Instructions for students to create an Information Processing 10 Final Project.

About This Guide
These guides are designed by the Global Digital
Citizen Foundation to help you gain a better
understanding of the 21st Century Fluencies and
how they work.
This guide contains a description of the stages of
Information Fluency, as well as a perspective on the
skills each stage develops and why they are important
for our students?and everyone?to learn.
We hope this information will help you with the
development of the Fluencies as you work to infuse
them into your students' learning experiences.

Simply put, this is one of my most favorite topics when it comes to talking about computers. In this video we layout the order of this lesson, as well as give basic definitions of:
•Machine-Level Security
•Network Security
•Internet Security
•Social Engineering

The act of physically protecting the computers. The first rule of any type of computer safety is restricting physical access to it. If a bad guy can get their hands on the computer assume they will be able to gain access to all data contained within.