Run by the University of Regina in Canada, this site offers free …
Run by the University of Regina in Canada, this site offers free resources for math teachers and their students, including a database where users can search for the answers to math questions.
Their Mathematics with a Human Face page includes information about careers in mathematics as well as profiles of mathematicians.
Splash Learn offer a complete K-5 math learning program built for your …
Splash Learn offer a complete K-5 math learning program built for your child that will boost confidence, increase scores and allow your child to enjoy a personalized learning path for catching up, enrichment or regular practice. Parents and teachers can sign up for free.
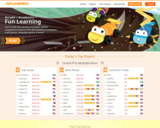
Arcademics make multiplayer educational games for students from K to eighth grade, …
Arcademics make multiplayer educational games for students from K to eighth grade, from free math games to language games. Arcademics combines the excitement of video games with educational content to produce a high rate of learning through exciting, focused repetition that enables automaticity and fluency. All games can be played seamlessly on any device using the web browser for free.
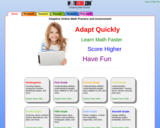
MathScore helps students acquire a deep understanding of math by providing adaptive …
MathScore helps students acquire a deep understanding of math by providing adaptive math practice that functions like self-guided lessons. MathScore is fun and improves math confidence and grittiness. For any important math concept, we help students achieve mastery in 3 phases: 1. Develop relatable, definition-level understanding: 2. Develop computational excellence: Using adaptive techniques, we efficiently develop strong computational skills. 3. Develop analytical understanding.
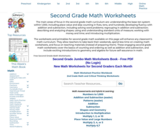
The main areas of focus in the second grade math curriculum are: …
The main areas of focus in the second grade math curriculum are: understanding the base-ten system within 1,000, including place value and skip-counting in fives, tens, and hundreds; developing fluency with addition and subtraction, including solving word problems; regrouping in addition and subtraction; describing and analyzing shapes; using and understanding standard units of measure; working with money and time; and introducing multiplication.
The worksheets and printables for second grade math available on this page will enhance any classroom's math curriculum. These engaging second grade math worksheets cover the basics of counting and ordering as well as addition and subtraction, and include exciting introductions to geometry and algebra for future self-assurance in math.
Check out these great video/curricular resources for Grade 12. The ROVER videos …
Check out these great video/curricular resources for Grade 12. The ROVER videos all indicate the curriculum outcomes that they address.
ROVER (Recommended Online Video Education Resources) is a video streaming service for Saskatchewan teachers and students in the PreK-12 education system. It is managed and maintained by the Saskatchewan Ministry of Education. ROVER is a video-on-demand service that provides teachers and students with the convenience of immediate access to streamed, educational videos that support curricula.
This site also offers all of the curriculum documents for all grade levels.
If you are unable to access the site, it may be because a Saskatchewan Ministry of Education Blackboard login is required. All students have an Edonline account, so contact your child's school or the Ministry of Education’s Support Desk at 1-866-933-8333 or email at stans@gov.sk.ca for login information. Your child's student number will be required.
Third graders are curious, capable and eager to share their ideas. With …
Third graders are curious, capable and eager to share their ideas. With that in mind, we’ve gathered together learning links and fun activities that will help kids build skills in literacy, math, science, and social studies—plus some just for fun! This list of third grade websites and activities is something kids can easily do at home with their families.
Check out Manitoba's Agriculture in the Classroom resources and activities which include …
Check out Manitoba's Agriculture in the Classroom resources and activities which include hundreds of bilingual resources, lesson plans, free downloads, learning kits and more. You can filter by grade, resource type (Fun Stuff, Learning Activities, Online Game, Reference, Resource Kit, Student Activity Sheet, Teacher's Guide, Video), subject (Art, Career Exploration, ELA, English, FAL, Food and Nutrition, Geography, Health, Math, Physical Education, Science, Social Studies, Technology) and language (English, French). This is a great companion resource to the AITC SK materials found at https://resourcebank.ca/courses/agriculture-educational-resources-ag-in-the-classroom.
Science North is thrilled to provide resources for students as well as …
Science North is thrilled to provide resources for students as well as professional learning to support Science and Technology being delivered to students at a distance.
These resources include independent, flexible and interactive STEM concepts that will inspire students and build their skills and core competencies.
Look for: ~ DOWNLOADABLE RESOURCES These downloadable resources contain a lesson plan and curriculum-linked handouts for students who do not have internet access. ~ PROFESSIONAL LEARNING Pre-recorded videos will provide teachers with the framework needed to complete an inquiry-based project with their students. ~ CLASSROOM VIDEOS Pre-recorded classroom videos will be available Monday through Friday, with each day covering a different grade level in English and French. The videos can be sent to students to provide them with key concepts and activities. ~ PRINTABLE HANDOUTS Worksheets will accompany classroom videos for students to print at home.
Every Friday Science North will provide Kindergarten teachers with a pre-recorded video …
Every Friday Science North will provide Kindergarten teachers with a pre-recorded video and printable resource.
Teachers will be able to share these YouTube videos and resources with students every week.
Included are classroom videos, student handouts, and offline lesson plans.
These videos and handouts can be sent to students to provide them with key concepts and activities that link to the curriculum.
The offline lesson plans provide a detailed explanation of the concepts and the procedure. This can be used to help teach the lesson. These will also be made available to students without internet access.
This site uses American standards, so filter by SKILL, not grade to …
This site uses American standards, so filter by SKILL, not grade to find what you need.
This site allows you to differentiate for a wide variety of needs quickly!
Create activities for PAPER or ONLINE learning. This can be used in the classroom and for distance learning. *daily review creator! *create mixed or spiral reviews to foster mastery *create practice pages to reinforce skills *print cheat sheets to explain skills to students *create flashcards for review *create modified versions of activities *create quizzes *multiple languages available *drills
*make your own spelling lists using word families or use pre-made lists
Lesson that uses Math and Art. Marvel at the beauty and intricacy …
Lesson that uses Math and Art. Marvel at the beauty and intricacy of various Indigenous examples of quillwork! Students demonstrate understanding of regular and irregular polygons including:
classifying types of triangles comparing side lengths comparing angle measures differentiating between regular and irregular polygons analyzing for congruence
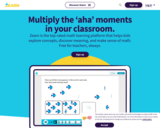
"Zearn is the top-rated math learning platform that helps kids explore concepts, …
"Zearn is the top-rated math learning platform that helps kids explore concepts, discover meaning, and make sense of math. Free for teachers, always."
Curriculum, digital lessons, made by teachers, onscreen teachers, visual models, differentiation.
*Students gained 11 weeks of math learning with Zearn digital lessons who used Zearn gained an additional 11 weeks of math learning in one school year.
The purpose of this lesson is to solve basic linear equations. Included …
The purpose of this lesson is to solve basic linear equations.
Included is a YouTube video to support Grade 9 Blended Learning Math - Unit 6.1: Linear Equations and Inequalities - Solving Equations by Using Inverse Operations.
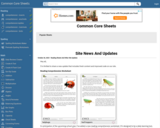
This resource explores how you can use The Writing Revolution sentence-level activities …
This resource explores how you can use The Writing Revolution sentence-level activities in Mathematics to build better writers and deepen mathematical understanding.
No restrictions on your remixing, redistributing, or making derivative works. Give credit to the author, as required.
Your remixing, redistributing, or making derivatives works comes with some restrictions, including how it is shared.
Your redistributing comes with some restrictions. Do not remix or make derivative works.
Most restrictive license type. Prohibits most uses, sharing, and any changes.
Copyrighted materials, available under Fair Use and the TEACH Act for US-based educators, or other custom arrangements. Go to the resource provider to see their individual restrictions.