"These three free digital courses introduce students to what data science is …
"These three free digital courses introduce students to what data science is and why it matters. Through interactive exercises, students explore foundational data science knowledge, including collecting, visualizing, and understanding data. Data Science Foundations is the 101-course with two extension opportunities in the form of a Financial Wellness and Banking Fraud simulation." Includes 3 courses: *foundations *financial wellness *banking fraud
Students pass around and distort messages written on index cards to learn …
Students pass around and distort messages written on index cards to learn how we use signals from GPS occultations to study the atmosphere. The cards represent information sent from GPS satellites being distorted as they pass through different locations in the Earth's atmosphere and reach other satellites. Analyzing GPS occultations enables better global weather forecasting, storm tracking and climate change monitoring.
The CLS provides educational resources for middle and senior years teachers across …
The CLS provides educational resources for middle and senior years teachers across Canada that relate to curriculum. Resources in the following topics have been developed: Light and Optics; Science and Society; Physical Sciences; Earth Sciences; Health Sciences; Chemistry; Physics; Biology.
"Educators and students across Canada can access ArcGIS software, support and teaching resources for free. All our resources are licensed under Creative Commons Attribution-NonCommercial-ShareAlike 4.0 International, and we encourage educators to share and adapt our resources to work with their courses.
ArcGIS is a powerful tool for learning in social studies for various reasons. It allows students to tell stories by visualizing, analyzing, and interpreting data related to location and place. This can be incredibly valuable in social studies, where understanding the spatial relationships between historical events, cultural phenomena, and natural resources can help students develop a deeper and more nuanced understanding of the world around them. Check it out"
In this open-ended, hands-on activity that provides practice in engineering data analysis, …
In this open-ended, hands-on activity that provides practice in engineering data analysis, students are given gait signature metric (GSM) data for known people types (adults and children). Working in teams, they analyze the data and develop models that they believe represent the data. They test their models against similar, but unknown (to the students) data to see how accurate their models are in predicting adult vs. child human subjects given known GSM data. They manipulate and graph data in Excel® to conduct their analyses.
This 10-day module builds on Grade 2 concepts about data, graphing, and …
This 10-day module builds on Grade 2 concepts about data, graphing, and line plots. The two topics in this module focus on generating and analyzing categorical and measurement data. By the end of the module, students are working with a mixture of scaled picture graphs, bar graphs, and line plots to problem solve using both categorical and measurement data.
Find the rest of the EngageNY Mathematics resources at https://archive.org/details/engageny-mathematics.
Inspired by plans for a Small Modular Reactor (SMR) in Saskatchewan, our …
Inspired by plans for a Small Modular Reactor (SMR) in Saskatchewan, our Grade 9 Team embarked on a cross-curricular project. Exploring SMRs' construction, operations, and impacts, we integrated indigenous perspectives on Treaty, Truth and Reconciliation, UNDRIP, and Duty to Consult. Through this, we aim to understand SMRs' implications while honoring indigenous voices.In the folder, you will find:1. Unit Plan2. Assignment Bundle - PDF3. Assignment Bundle - Word Docs4. Resources
Real science, real stories, and real data to engage students in exploring …
Real science, real stories, and real data to engage students in exploring the living world.
BioInteractive offers an array of engaging resources including videos, simulations, virtual labs, and classroom activities, all designed to bring biological research to life. These resources are accompanied by thorough teacher guides written by educators.
Covering topics like evolution, ecology, genetics, biodiversity, and human health, the activities are based on real research, such as data from Gorongosa National Park's trail cameras used to create biomass pyramids. Teachers can easily navigate through the materials by topic or resource type, with options like Collections or Short Courses available. Additionally, film guides, posters, and downloadable apps are provided to support classroom integration.
Create a free account to connect with educators, access teaching tools, explore the resource library and create custom resource collections.
Media Description | 5 minutes We're diving for data! With the help …
Media Description | 5 minutes We're diving for data! With the help of an “eye in the sky” and some savvy scuba surveyors, researchers are estimating the number of herring in the water... by counting their eggs! But modern methods can only tell us so much. To get the full picture, we turn to the people who know the herring best. If you like this content you can see all of the available resources in the Harvest module in the Ocean School Help Centre (https://help.oceanschool.nfb.ca/educational-resources/module-guides/the-harvest-module-guide). >> Activity Description | 5 minutes'Herring census' - Stock assessment survey: Students are challenged to determine which herring stock will most likely have a healthy population in the future! Students perform a herring census using a simplified version of the methods used by scientists at Fisheries and Oceans Canada. An additional data sheet is available with this activity: https://docs.google.com/spreadsheets/d/1BRhtQ3t1PEN3wHJwtZTuELdVH3hnC56jjCCXEFBw95I/template/preview
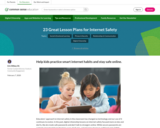
"The best internet safety lessons recognize the complexity of these topics and …
"The best internet safety lessons recognize the complexity of these topics and help students build the critical-thinking skills and habits of mind to navigate the dilemmas they encounter."
This site links in the best lessons for internet safety from Common Sense Media for K-12.
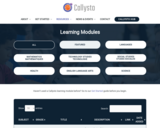
"Callysto is a free, multimodal learning program for grades 5-12 students in …
"Callysto is a free, multimodal learning program for grades 5-12 students in Canada. The program is part of a two-year pilot project by Cybera and the Pacific Institute for Mathematical Sciences (PIMS), who received funding from the federal government’s CanCode program to build and employ new technologies that promote digital literacy and help Canada’s youth develop the foundational skills required to become the future drivers of innovation."
Learning modules are available for Math, ELA, Science, Social, etc. Click RESOURCES then select - learning modules, lesson plans, Indigenous content, data, computational thinking, problem solving. Use the "bubbles" to filter to the subject.
Click GET STARTED to find the teacher starter kit and free full courses on computing science 10, AI, computational thinking, data science.
Math Antics has amazing videos to explain concepts for Math. The videos …
Math Antics has amazing videos to explain concepts for Math. The videos are very clear and explicit and students love them. All of the video lessons are FREE.
There are also follow up exercises, videos and worksheets that students can use to solidify learning - but you will be required to pay $20 a year to access these. hat being said, it's super useful even without a paid account!
The videos are organized by strand, and all are free.
Math is Fun is a free website offering mini explanations of math …
Math is Fun is a free website offering mini explanations of math topics from all levels, including elementary to high school. It also features tons of games and puzzles to explore. It also includes an illustrated math dictionary with interactive activities for the students to explore and deepen mathematical understanding.
Find resources for different age levels in the following areas: Pre-K to 2 - Numbers - Algebra - Geometry - Data - Measurement - Money
3 to 6 - Numbers - Algebra - Geometry - Data - Measurement - Money
7 to 9 - Numbers - Algebra - Geometry - Data - Measurement - Money
Students learn about the statistical analysis of measurements and error propagation, reviewing …
Students learn about the statistical analysis of measurements and error propagation, reviewing concepts of precision, accuracy and error types. This is done through calculations related to the concept of density. Students work in teams to each measure the dimensions and mass of five identical cubes, compile the measurements into small data sets, calculate statistics including the mean and standard deviation of these measurements, and use the mean values of the measurements to calculate density of the cubes. Then they use this calculated density to determine the mass of a new object made of the same material. This is done by measuring the appropriate dimensions of the new object, calculating its volume, and then calculating its mass using the density value. Next, the mass of the new object is measured by each student group and the standard deviation of the measurements is calculated. Finally, students determine the accuracy of the calculated mass by comparing it to the measured mass, determining whether the difference in the measurements is more or less than the standard deviation.
(Nota: Esta es una traducción de un recurso educativo abierto creado por …
(Nota: Esta es una traducción de un recurso educativo abierto creado por el Departamento de Educación del Estado de Nueva York (NYSED) como parte del proyecto "EngageNY" en 2013. Aunque el recurso real fue traducido por personas, la siguiente descripción se tradujo del inglés original usando Google Translate para ayudar a los usuarios potenciales a decidir si se adapta a sus necesidades y puede contener errores gramaticales o lingüísticos. La descripción original en inglés también se proporciona a continuación.)
Este módulo de 10 días se basa en conceptos de grado 2 sobre datos, gráficos y parcelas de línea. Los dos temas en este módulo se centran en generar y analizar datos categóricos y de medición. Al final del módulo, los estudiantes están trabajando con una mezcla de gráficos de imágenes escalados, gráficos de barras y gráficos de línea para resolver problemas utilizando datos categóricos y de medición.
Encuentre el resto de los recursos matemáticos de Engageny en https://archive.org/details/engageny-mathematics.
English Description: This 10-day module builds on Grade 2 concepts about data, graphing, and line plots. The two topics in this module focus on generating and analyzing categorical and measurement data. By the end of the module, students are working with a mixture of scaled picture graphs, bar graphs, and line plots to problem solve using both categorical and measurement data.
Find the rest of the EngageNY Mathematics resources at https://archive.org/details/engageny-mathematics.
The following resource contains the assets (or resources) to accompany the Sask …
The following resource contains the assets (or resources) to accompany the Sask DLC Mathematics 8 course. Please note that this is not the content of the course, but the assets used to support and deliver it. The files are organized in a zip folder and a collection.
No restrictions on your remixing, redistributing, or making derivative works. Give credit to the author, as required.
Your remixing, redistributing, or making derivatives works comes with some restrictions, including how it is shared.
Your redistributing comes with some restrictions. Do not remix or make derivative works.
Most restrictive license type. Prohibits most uses, sharing, and any changes.
Copyrighted materials, available under Fair Use and the TEACH Act for US-based educators, or other custom arrangements. Go to the resource provider to see their individual restrictions.